Configuration
After installation, use the Configuration Management page to tailor Patronus SIEM to your environment. All settings are accessible from Configuration → Configuration in the navigation menu.
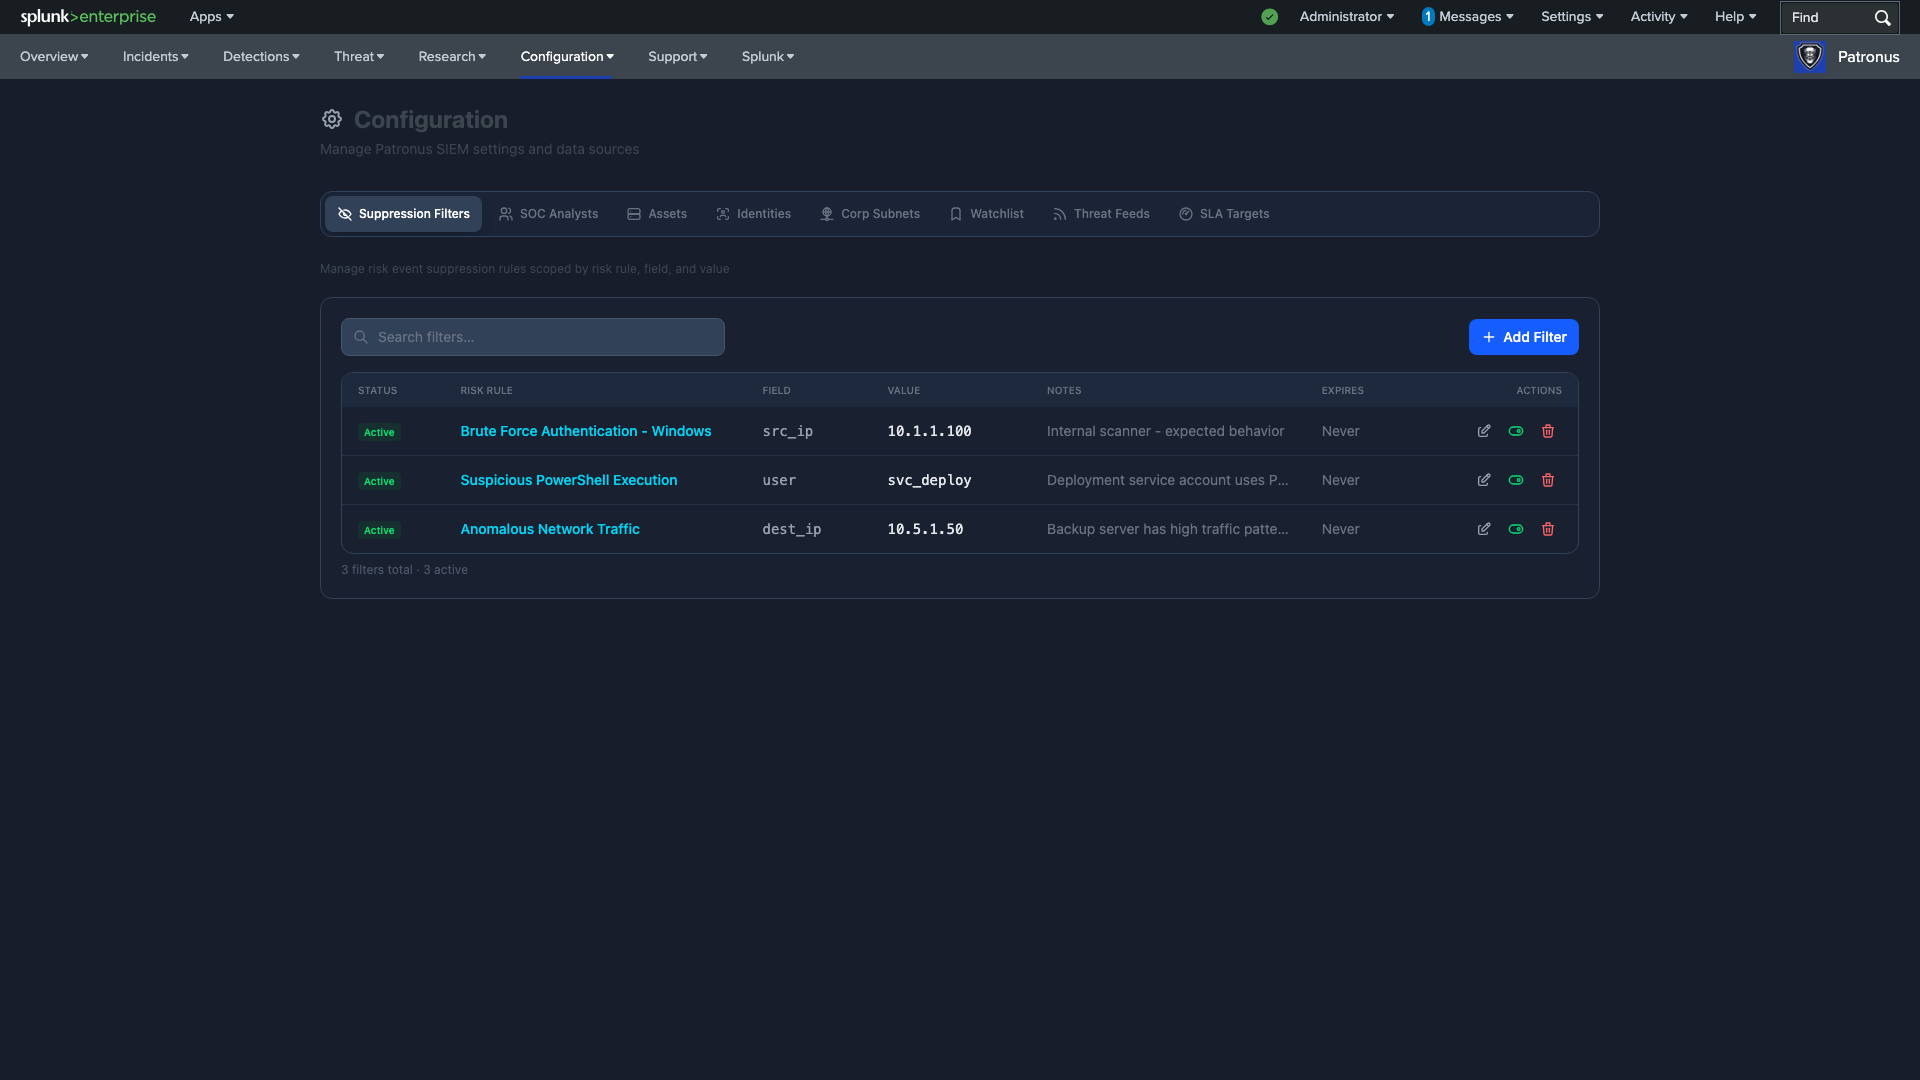
Configuration Tabs
The Configuration Management page uses a tabbed interface to organize all settings in one place. Each tab manages a specific KVStore collection with full CRUD (Create, Read, Update, Delete) operations.
Suppression Filters
Reduce false positives by suppressing known-good activity patterns. Suppression filters prevent matching risk events from contributing to incident scores.
- Risk Rule — select the specific detection rule to suppress.
- Field & Value — specify the field name (e.g.,
src_ip,user,dest_ip) and value to match. - Notes — document why the suppression was created (e.g., "Internal scanner — expected behavior").
- Expiration — optionally set an expiration date so suppressions auto-expire.
- Status — toggle filters between Active and Disabled without deleting them.
Active suppression filters are applied via the ss_search_filter macro, which is automatically appended to all detection searches.
Caution: Overly broad suppression filters can hide genuine threats. Review suppressions periodically and keep them as specific as possible. The Scoreboard shows a badge with the active suppression count for visibility.
SOC Analysts
Manage the analyst roster for incident assignment and workload tracking.
- Analysts can be added manually or auto-populated from Splunk users with the
patronus_userrole. - Each analyst appears in the incident assignment dropdown across all incident views.
- Track analyst workload and response times via the Incident Metrics and Executive Summary pages.
- The Shift Handoff report shows per-analyst activity summaries.
Assets
Define and enrich your asset inventory for deep-dive research views. The Assets tab provides full KVStore CRUD for the ss_asset_lookup collection.
- Fields: IP Address, DNS Name, MAC Address, Category (server, workstation, network, etc.), Owner, Business Unit, Priority (critical, high, medium, low, info).
- Assets automatically link to risk events, incidents, network activity, and CIM data model correlations.
- The Asset Deep Dive page uses this lookup to enrich investigation results.
- Import from CSV or add entries individually through the UI.
Identities
Manage user identities for correlation and research. The Identities tab provides full KVStore CRUD for the ss_identity_lookup collection.
- Fields: Username, First Name, Last Name, Email, Manager, Department, Category (admin, user, service), Priority (critical, high, medium, low, info).
- Identities link to authentication events, risk scores, incidents, and CIM data model correlations.
- The Identity Deep Dive page uses this lookup to enrich investigation results.
- Import from Active Directory, HR systems, or manual CSV.
Corporate Subnets
Define your internal network ranges so Patronus can classify traffic as internal vs. external. This powers the Network view's relationship mapping and affects threat intelligence correlation.
- Enter subnets in CIDR notation (e.g.,
10.0.0.0/8,192.168.1.0/24). - Add a label for each subnet (e.g., "Corporate LAN", "DMZ", "VPN Pool").
- Internal-to-external traffic patterns are highlighted in the Network relationship map.
Watchlist
The Watchlist tracks high-priority risk objects (users, hosts, IPs) that should receive elevated attention.
- Add entries by specifying the risk object value and type (user, system, or other).
- Add notes to explain why an entity is being watched.
- Watchlisted entities are flagged with badges on the Scoreboard and in Incident views.
- The Scoreboard's Watchlist table shows real-time risk scores and trends for all watched entities.
Threat Feeds
Configure external threat intelligence sources for automated ingestion. Patronus supports URL-based feeds that provide lists of indicators.
- Feed types: IP, Domain, File Hash (MD5, SHA1, SHA256).
- URL: HTTP/HTTPS endpoint that returns a plaintext list of indicators.
- Update interval: Configure how often feeds are refreshed (hourly, daily, etc.).
- Custom indicators: Manually add individual indicators alongside automated feeds.
- Feed health is monitored on the Threat Intelligence Dashboard with staleness indicators (Fresh <24h, Aging 24–72h, Stale >72h).
- Patronus correlates feed data against network, web, and endpoint activity in real time.
SLA Targets
Configure service level agreement targets for incident response metrics.
- MTTA Target — Mean Time to Acknowledge. The maximum acceptable time between incident creation and first analyst assignment or status change (default: 1 hour).
- MTTR Target — Mean Time to Resolve. The maximum acceptable time between incident creation and resolution (default: 24 hours).
- SLA compliance is tracked on the Incident Metrics page and Executive Summary with gauge visualizations and "Breached" indicators.
- Weekly compliance trends are shown with target (80%) and threshold (50%) reference lines.
Risk Thresholds
The risk threshold determines when accumulated risk on an entity triggers an incident. This is the core tuning parameter for noise reduction.
- Default threshold: 100 points within a 24-hour window.
- Lower thresholds create more incidents (higher sensitivity).
- Higher thresholds require more evidence before triggering (lower false positives).
- Thresholds can be adjusted globally or per-entity type.
Recommendation: Start with the default threshold and tune based on your environment's alert volume. Use the Scoreboard to monitor which entities are accumulating risk and adjust thresholds accordingly. The Hunt Library's enable/disable toggles let you quickly control which detections contribute to risk scoring.
Detection Management
Detection rules (saved searches) are managed through the Hunt Library page. From there you can:
- Enable/Disable detection rules without editing them.
- Run Now (dispatch) any detection rule on demand, including disabled rules.
- Edit MITRE mappings — assign technique IDs to detections using the inline editor. Tactic assignments are inferred automatically.
- View details — expand any detection to see its full description, search query, schedule, and contributing events.
License Management
View and manage your Patronus license from Configuration → License Management.
- View current license status, tier, seat count, and expiration.
- Update your license key when renewing or upgrading.
- Deactivate the license to unbind from this Splunk instance (for migration).
- Licenses are validated against the Patronus license server with periodic check-ins.
- Grace period support allows continued operation for a limited time if license validation fails temporarily.
Next Steps
Once configured, see the Usage Guide to learn how to use the dashboards, investigate incidents, and manage your SOC workflow.