Usage Guide
This guide covers daily use of Patronus SIEM v2.0.0 — from the Executive Summary to incident investigation, threat intelligence, shift handoffs, and resolution.
Executive Summary
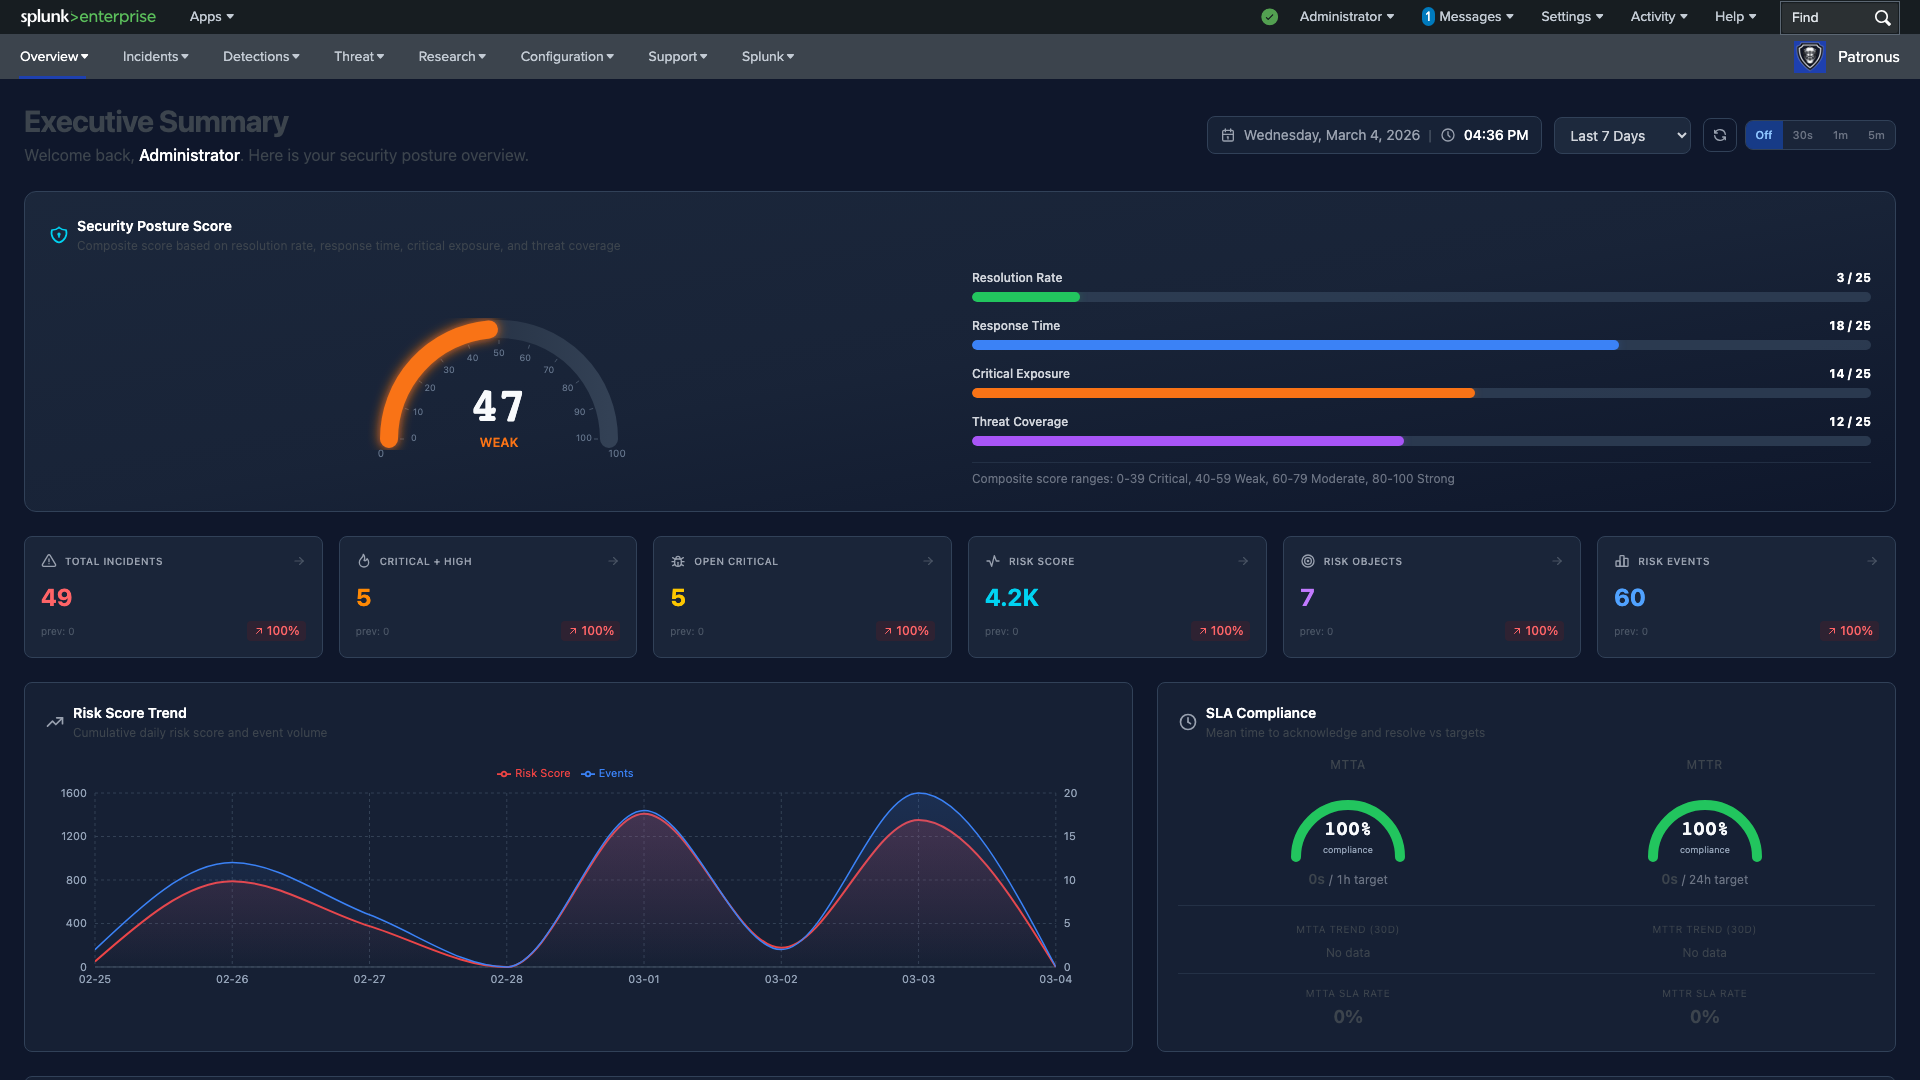
The Executive Summary is the default landing page and provides high-level KPIs for security leadership.
- Security Posture Score — a composite gauge (0–100) calculated from resolution rate, response time, critical exposure, and threat coverage. Each factor is scored out of 25.
- Incident KPIs with trend indicators: Total Incidents, Critical + High, Open Critical, Risk Score, Risk Objects, and Risk Events.
- Risk Score Trend — cumulative daily risk score and event volume over time.
- SLA Compliance — MTTA and MTTR compliance gauges with 30-day trend.
- Incident Status Pipeline — visual breakdown of incidents across lifecycle stages.
- Threat Map — geographic visualization of threat intelligence matches.
Click any KPI card to drill down into the corresponding detail view.
Risk Scoreboard
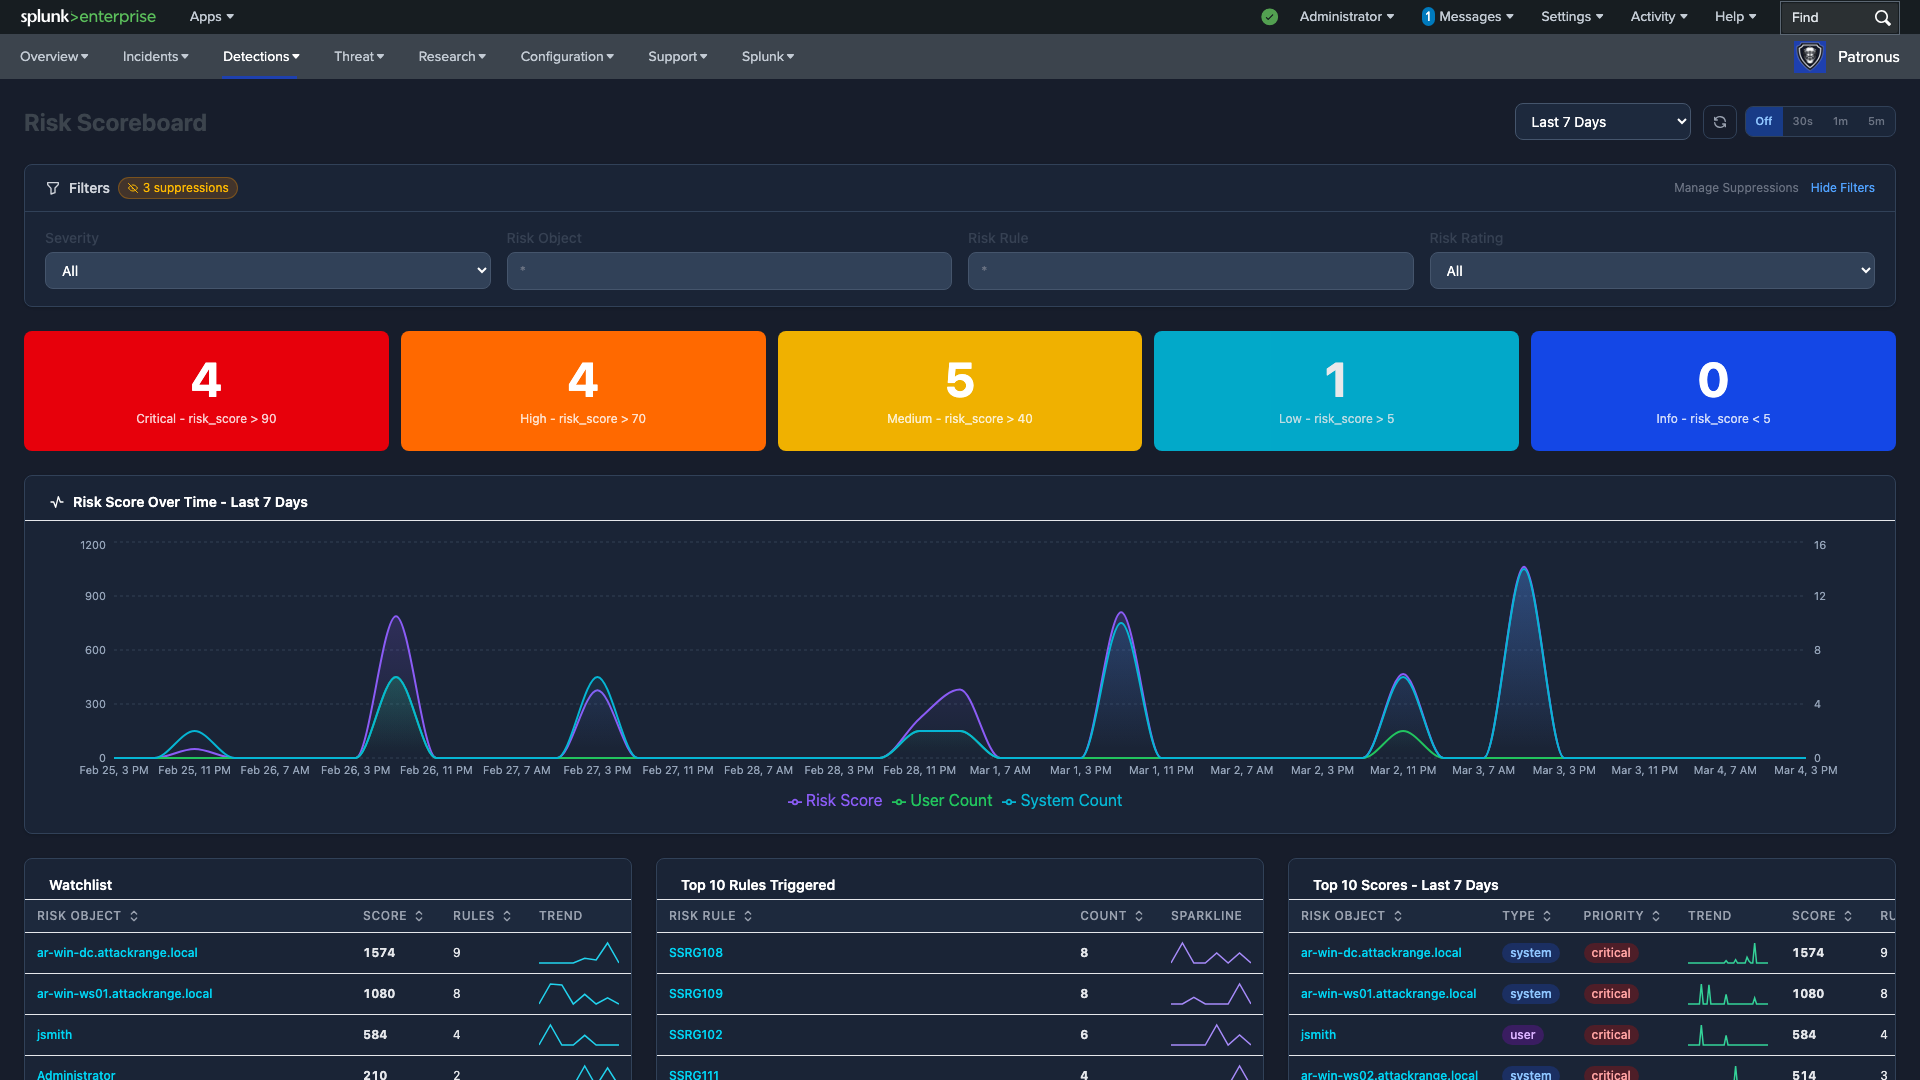
The Scoreboard is the primary operational view for SOC analysts. It shows all entities with active risk scores in a real-time view.
- Severity Cards — color-coded counters for Critical (red), High (orange), Medium (yellow), Low (cyan), and Info (blue) risk objects.
- Risk Score Over Time — dual-axis area chart showing cumulative risk score alongside user and system counts.
- Watchlist — sortable table showing tracked entities with score, rule count, and inline sparklines.
- Top 10 Rules Triggered — ranked bar chart of the most active detection rules.
- Top 10 Scores — entity leaderboard with type, priority badge, trend sparklines, score, and rule count.
- Suppression Filters — active suppression count badge with quick link to manage filters.
- Interactive Filters — filter by severity, risk object, risk rule, and risk rating.
Click any entity to see a detailed timeline of risk-generating events.
Incident Management
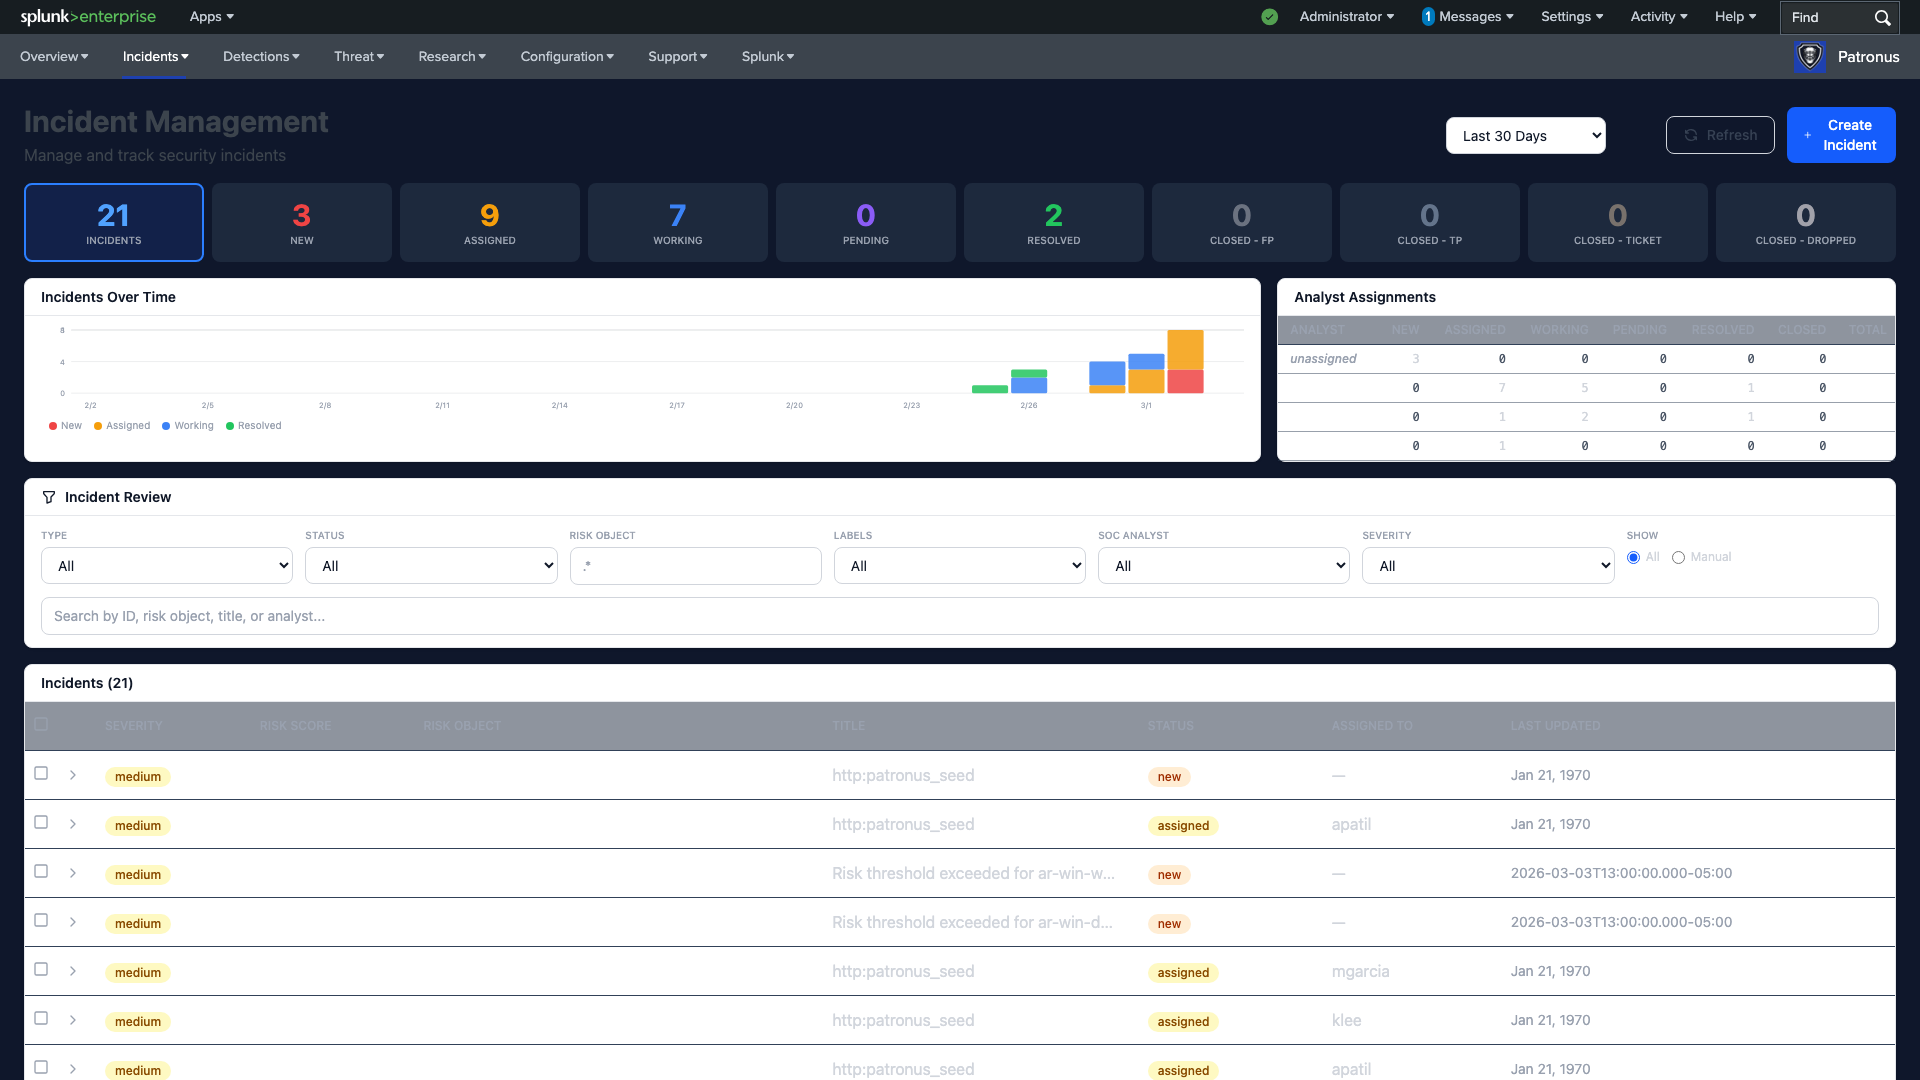
The Incident Management page is the central hub for managing security incidents through their full lifecycle.
- Status Pipeline — clickable cards showing incident counts across stages: New, Assigned, Working, Pending, Resolved, Closed (FP, TP, Ticket, Dropped).
- Incidents Over Time — stacked area chart showing incident creation and resolution trends by status.
- Analyst Assignments — workload matrix showing each analyst's incident distribution across statuses.
- Incident Review Table — sortable, filterable table with severity badges, risk scores, risk objects, titles, status, assigned analyst, and last updated timestamps.
- Filtering — filter by type, status, risk object, labels, analyst, severity, or search by ID, title, or analyst name.
- Create Incident — manually create incidents with custom titles and descriptions.
Investigation Workflow
- Expand an incident row — click any row to see full incident details inline.
- Review the risk timeline — see all detection events that contributed to this incident, ordered chronologically.
- Examine risk objects — identify the users, hosts, or IPs involved.
- Drill into events — click individual detection events to see the raw Splunk event data.
- Deep-dive into entities — navigate to Asset or Identity deep-dive pages for full context.
- Add notes — document findings as you investigate. Notes include timestamps and author names.
- Update status — move the incident through New → Assigned → Working → Pending → Resolved → Closed.
- Assign an analyst — assign or reassign to any SOC analyst.
Incident Metrics
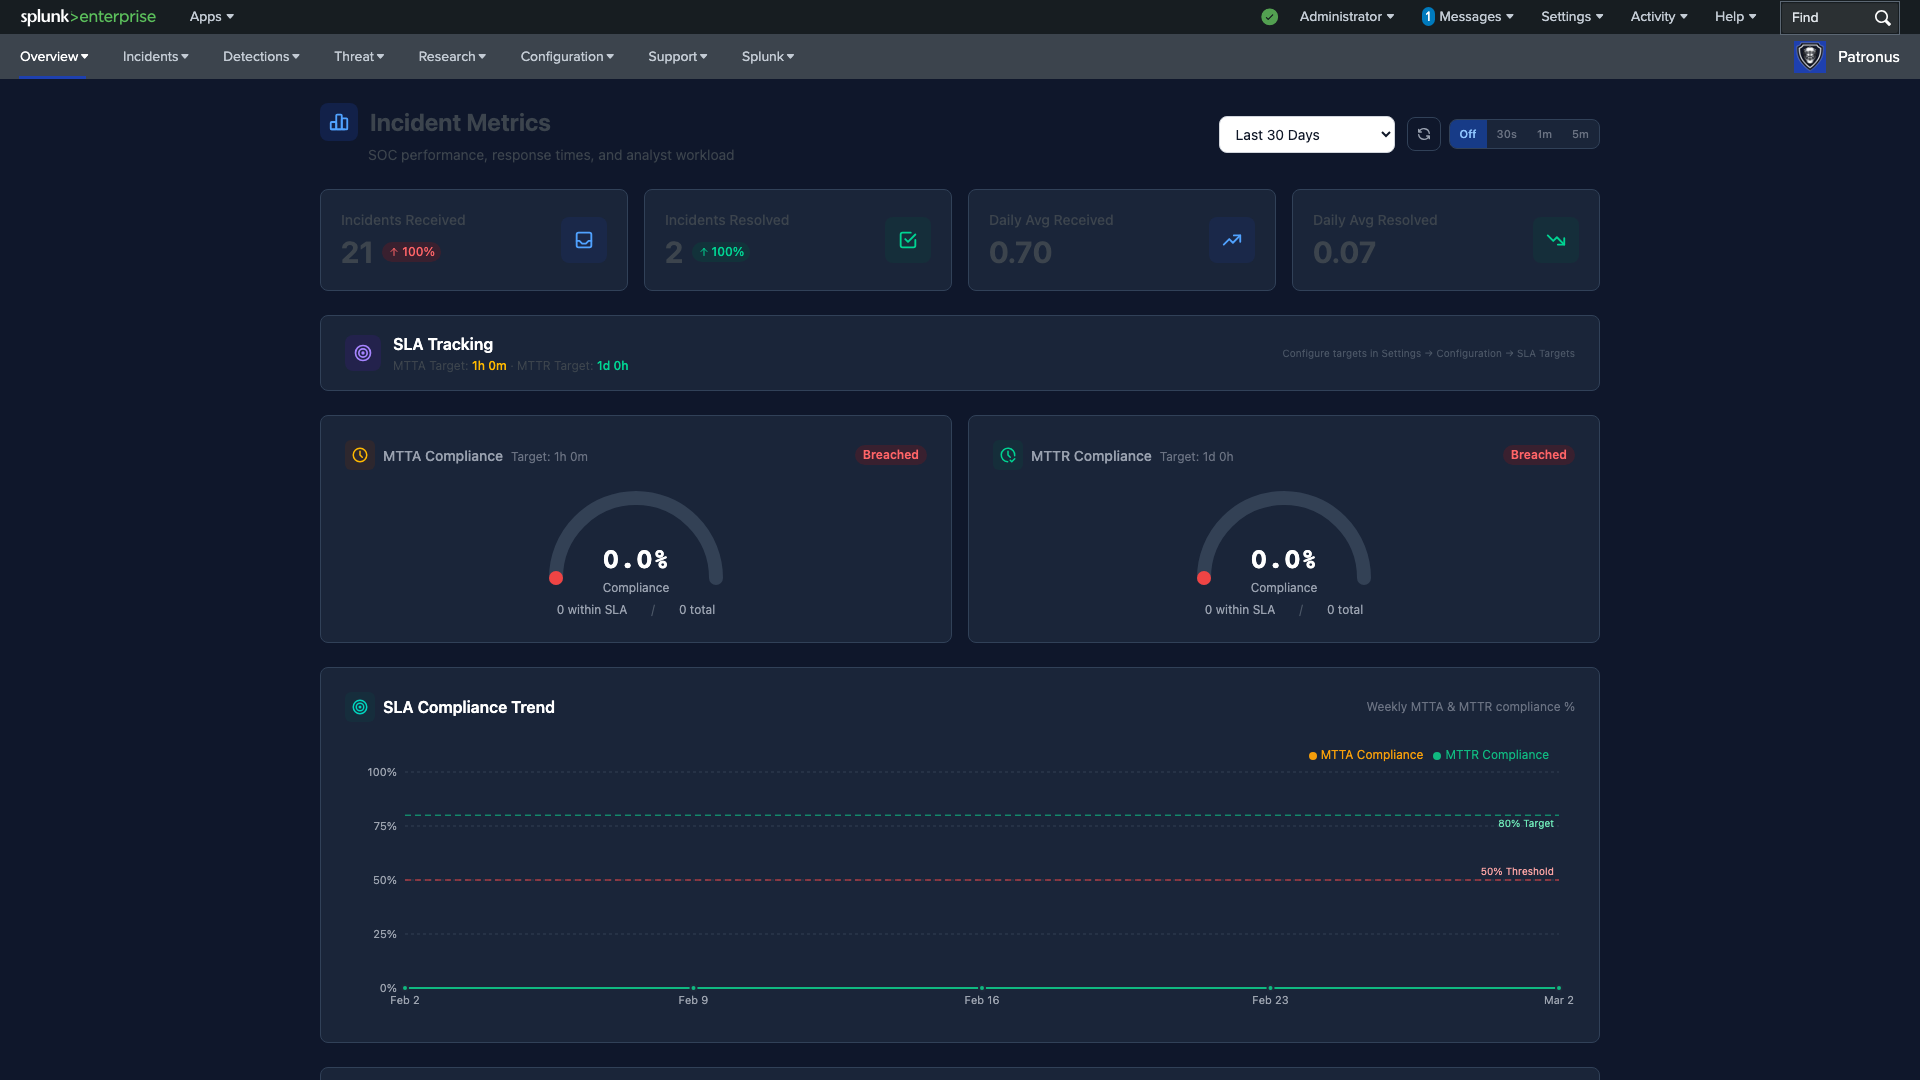
The Incident Metrics (Analysis) page provides SOC performance analytics, response times, and analyst workload data.
- KPI Cards — Incidents Received, Incidents Resolved, Daily Avg Received, Daily Avg Resolved (all with trend indicators).
- SLA Tracking — MTTA and MTTR compliance gauges with configurable targets. "Breached" badges appear when compliance falls below threshold.
- SLA Compliance Trend — weekly MTTA and MTTR compliance percentages with target and threshold reference lines.
- Incident Outlook — created vs. resolved over time.
- Analyst Performance Table — per-analyst breakdown of assigned incidents, resolution rates, and average response times.
Incident Report
The Incident Report page provides comprehensive reporting and analytics with export capabilities.
- KPI Summary — Total Incidents, New Today, Resolved Today, Open, Avg Risk Score, Avg Event Count.
- Mean Time to Resolve and Resolution Rate with visual indicators.
- Incident Trend — New vs Resolved over time with stacked area chart.
- Cumulative Open Incidents — running total of unresolved incidents.
- Distribution Charts — Status, Severity, and Incidents by Type breakdowns.
- Export — Print or export to CSV for compliance and reporting requirements.
Hunt Library
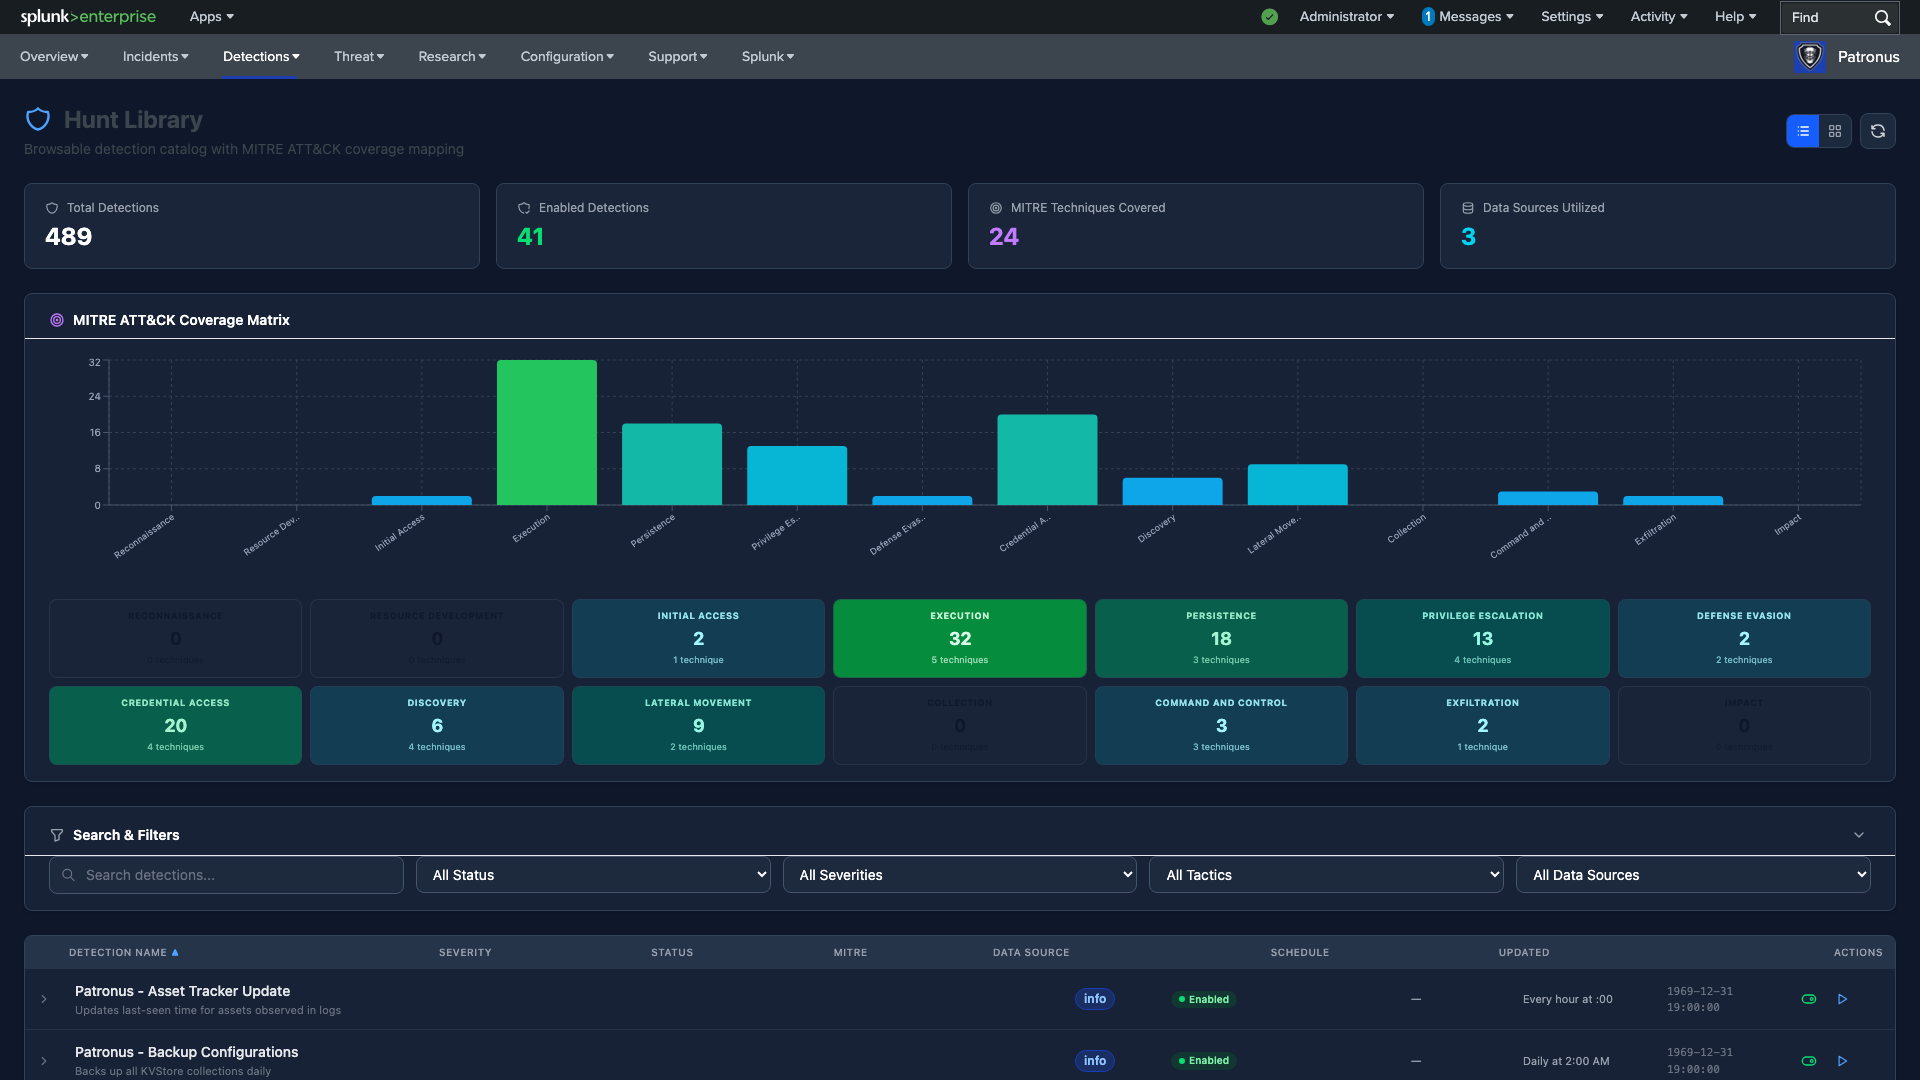
The Hunt Library is a browsable detection catalog with MITRE ATT&CK coverage mapping. It provides operational control over all detection rules.
- KPI Cards — Total Detections, Enabled Detections, MITRE Techniques Covered, Data Sources Utilized.
- MITRE ATT&CK Coverage Matrix — bar chart showing detection count per tactic, with tactic summary cards showing technique counts.
- Detection Table — full list of saved searches with severity badges, enabled/disabled status, MITRE technique tags, data source, schedule, and last updated timestamp.
- Search & Filters — search by name, filter by status (enabled/disabled), severity, tactic, or data source.
- Actions — toggle enable/disable, run now (dispatch), and expand rows for details.
- MITRE Mapping Editor — inline editor to assign or update MITRE technique IDs (pipe-separated) for any detection. Changes automatically infer tactic assignments.
Tip: Use the Run Now button to manually dispatch any detection rule, even if it's currently disabled. Patronus will temporarily enable the search, dispatch it, and re-disable it automatically.
MITRE ATT&CK Coverage
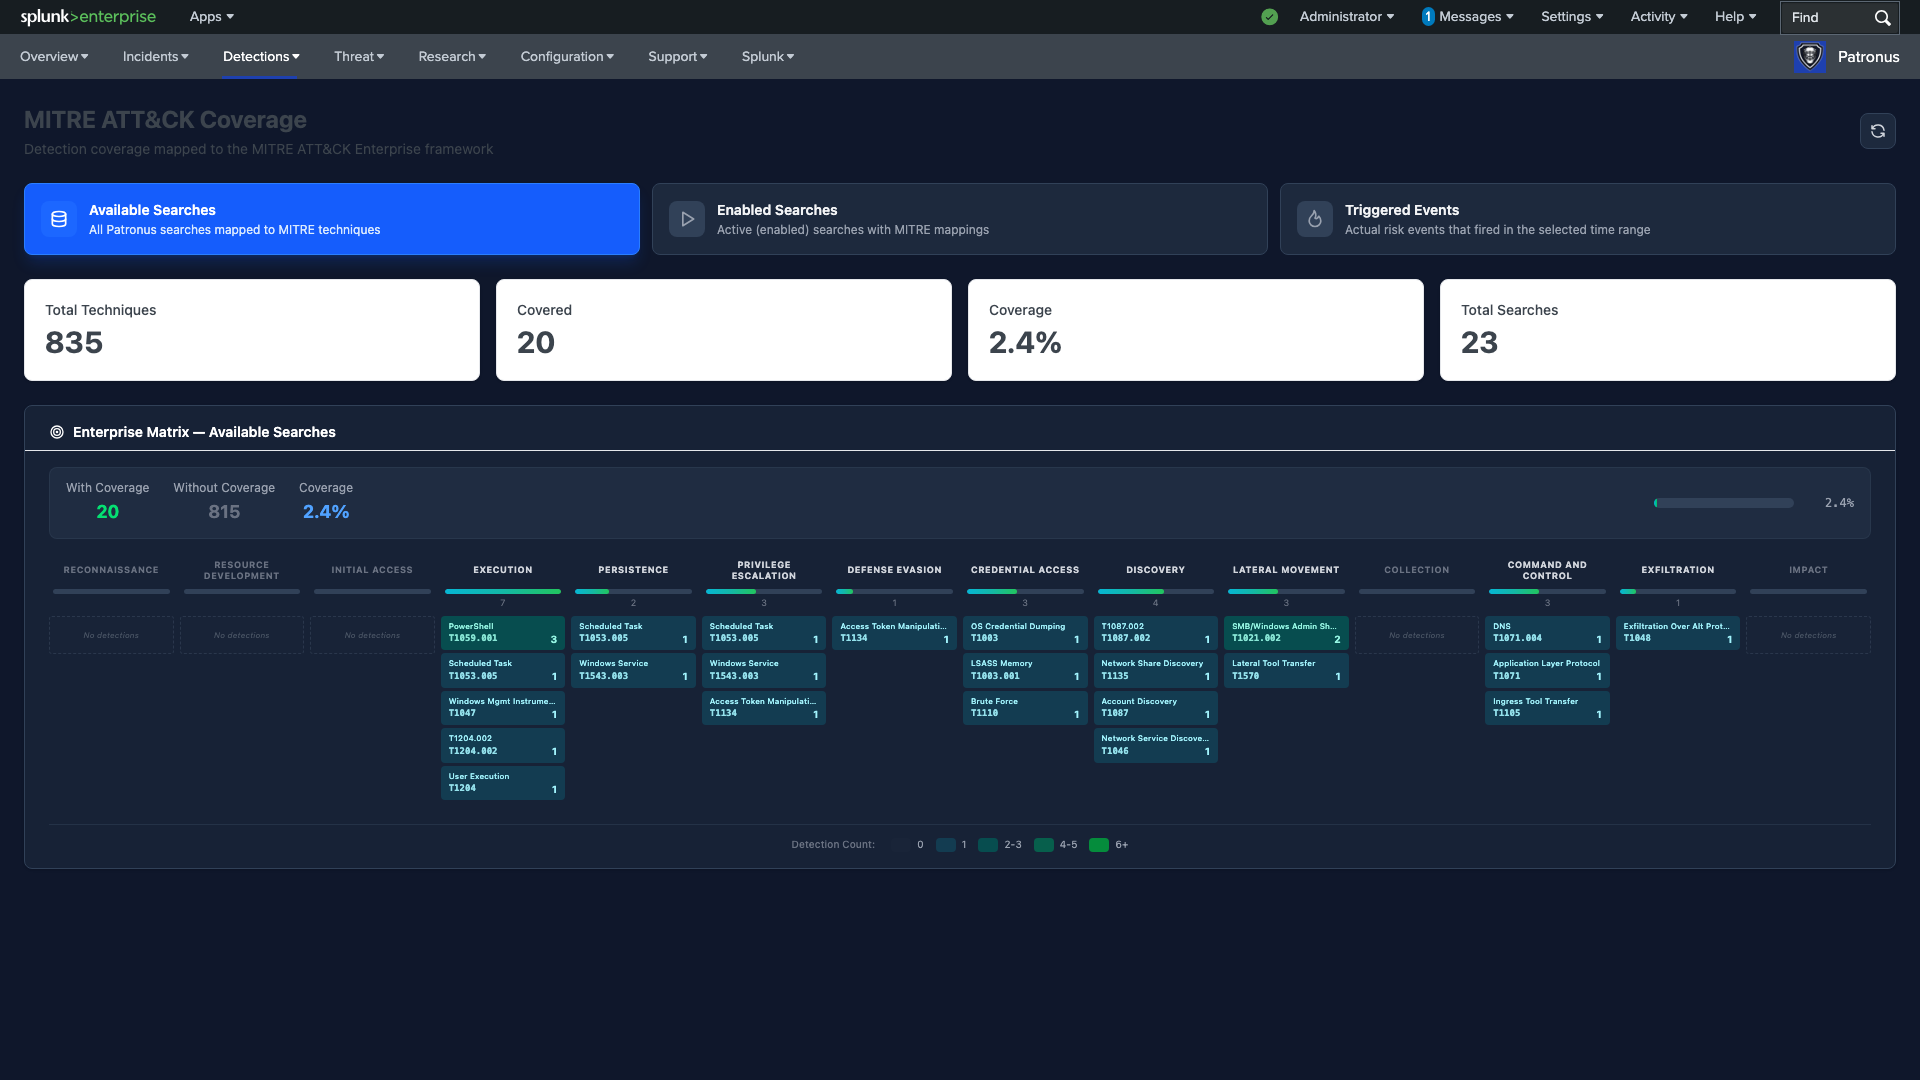
The MITRE ATT&CK page visualizes your detection coverage against the Enterprise ATT&CK framework with three viewing modes.
- Available Searches — all saved searches mapped to MITRE techniques.
- Enabled Searches — only active (enabled) searches with MITRE mappings.
- Triggered Events — actual risk events that fired in the selected time range, showing real-world coverage.
Each mode displays:
- Coverage Statistics — Total Techniques, Covered count, Coverage percentage, and Total Searches.
- Enterprise Matrix — full matrix with techniques grouped by tactic column. Color intensity indicates detection density (0, 1, 2–3, 4–5, 6+).
- Click any technique tile to see which detection rules provide coverage for that technique.
Shift Handoff
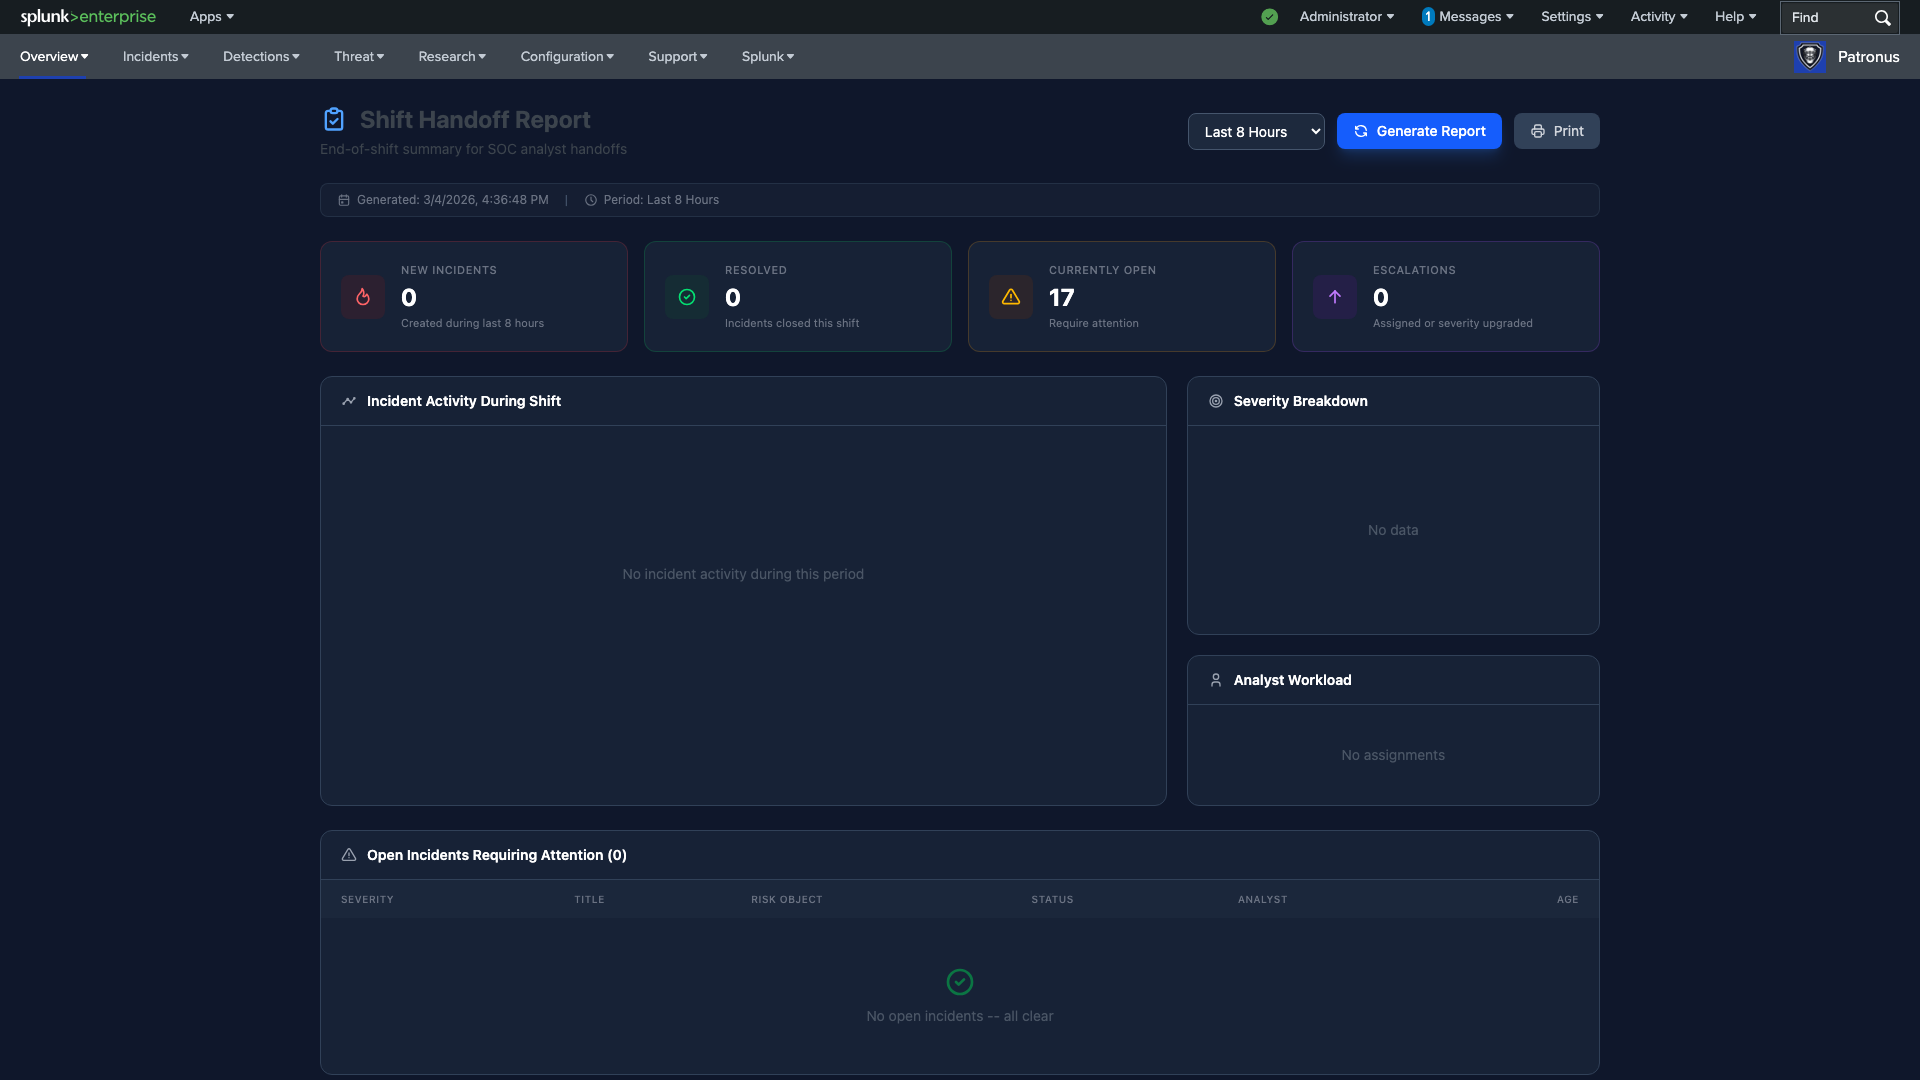
The Shift Handoff page generates end-of-shift summary reports for SOC analyst transitions.
- Period Selection — choose Last 8 Hours, Last 12 Hours, or Last 24 Hours for shift coverage.
- Shift Summary KPIs — New Incidents, Resolved, Currently Open, and Escalations during the shift period.
- Incident Activity — timeline of incident creation and resolution during the shift.
- Severity Breakdown — pie chart of incident severity distribution.
- Analyst Workload — per-analyst incident assignment and resolution counts.
- Open Incidents Requiring Attention — table of unresolved incidents with severity, title, risk object, status, analyst, and age.
- Shift Notes — free-text notes that persist across sessions. Notes include timestamps and author names for audit trail.
- Generate Report & Print — generate a formatted report or print directly from the browser.
Threat Intelligence
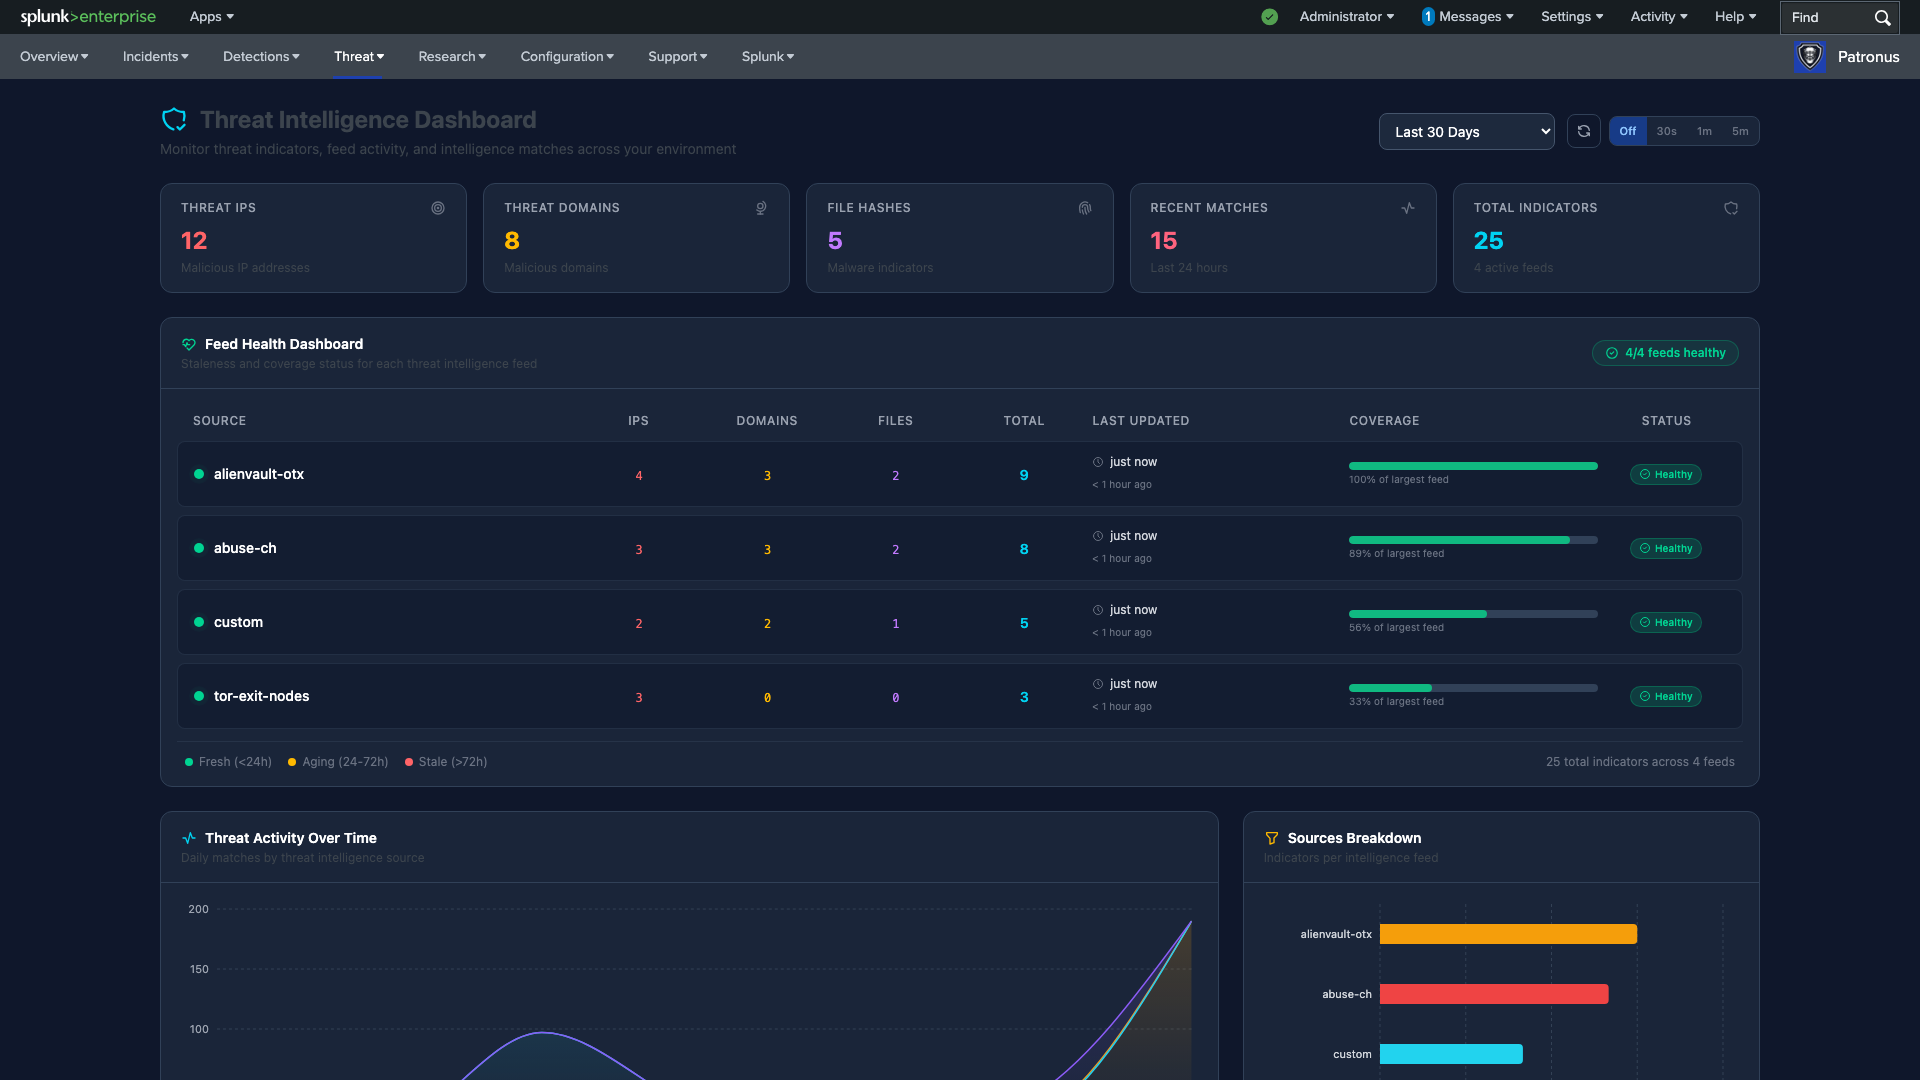
The Threat Intelligence Dashboard monitors threat indicators, feed activity, and intelligence matches across your environment.
- Indicator KPIs — Threat IPs, Threat Domains, File Hashes, Recent Matches, and Total Indicators with source counts.
- Feed Health Dashboard — per-feed status table showing source name, indicator counts (IPs, domains, files), last updated time, coverage percentage bar, and health status (Healthy/Stale).
- Auto-Refresh — configurable refresh intervals (30s, 1m, 5m) for real-time monitoring.
- Threat Activity Over Time — daily matches by threat intelligence source.
- Sources Breakdown — horizontal bar chart of indicators per intelligence feed.
Threat Inspector
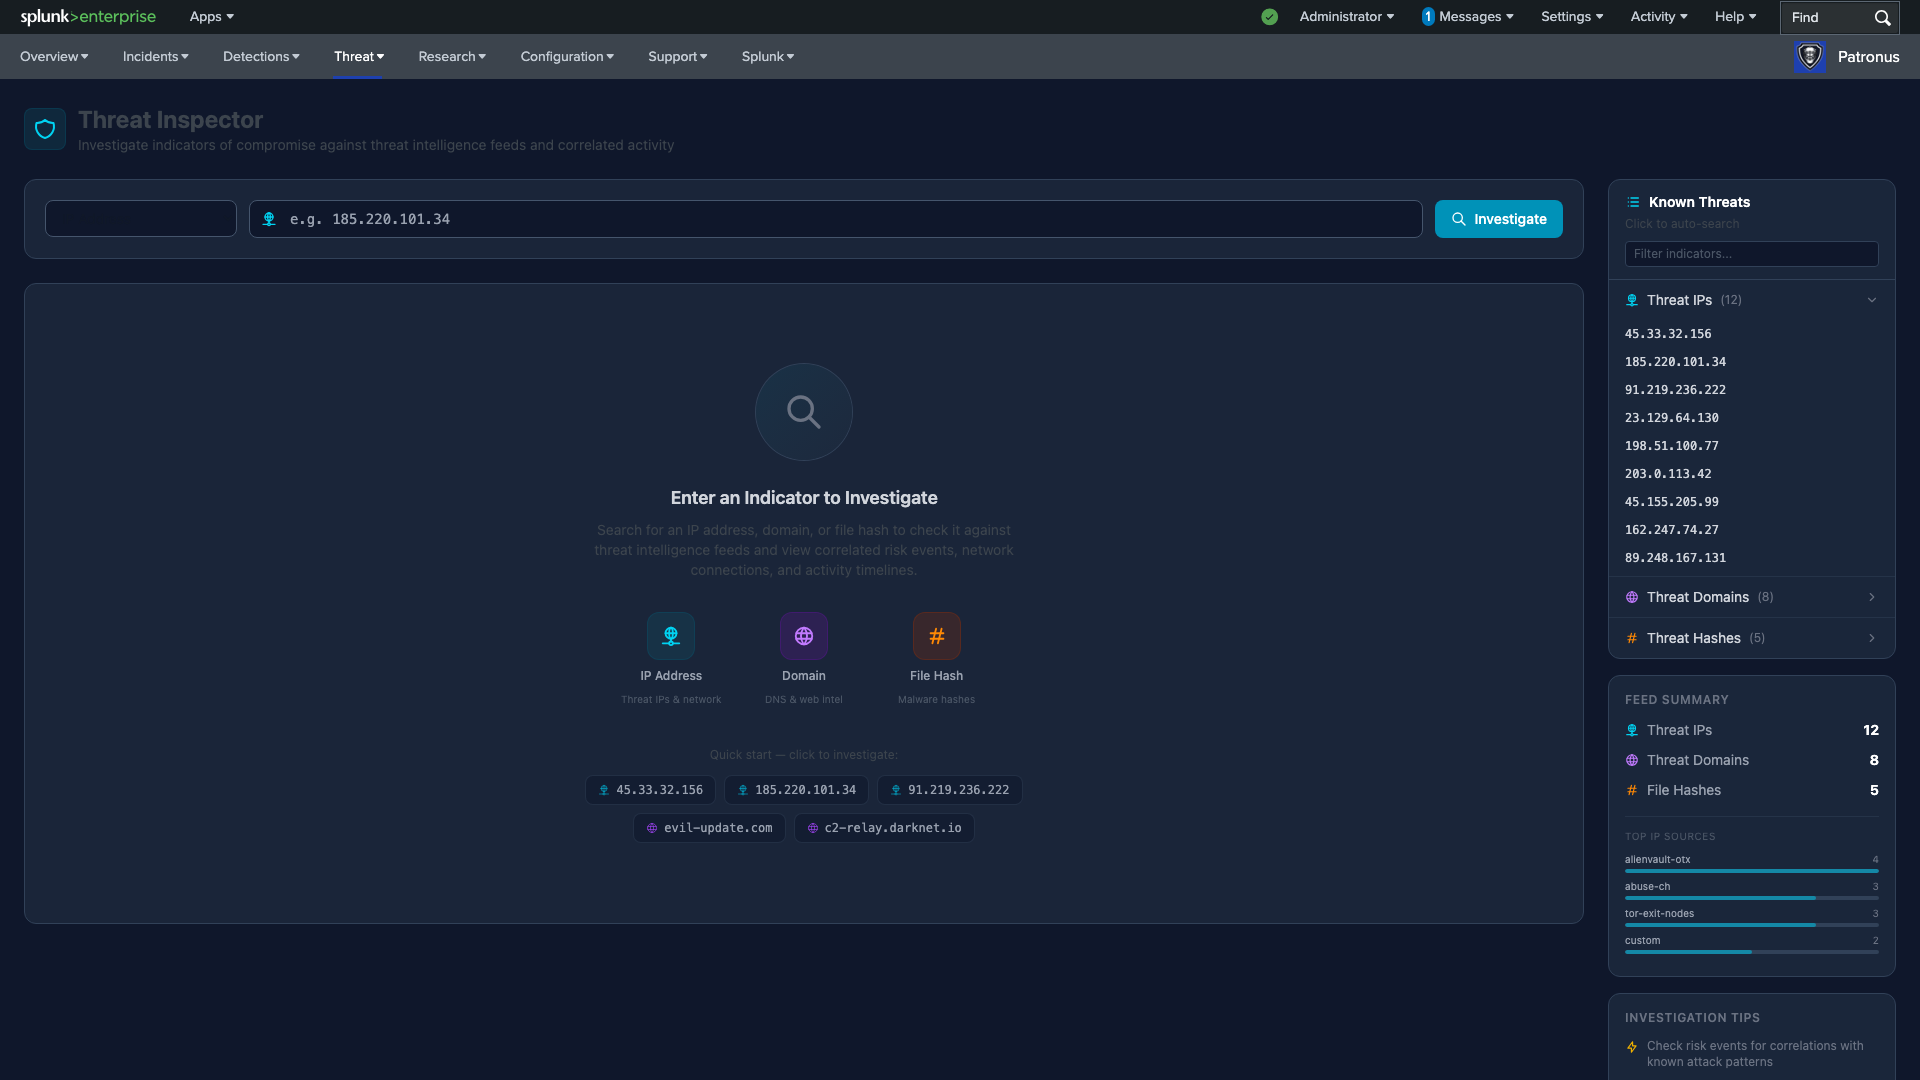
The Threat Inspector is a dedicated investigation tool for indicators of compromise.
- Search — enter an IP address, domain, or file hash to investigate against threat intelligence feeds.
- Known Threats Sidebar — browsable list of all known threat IPs, domains, and hashes with click-to-search functionality.
- Feed Summary — total indicator counts by type.
- Quick Start — click pre-loaded indicators to immediately investigate.
- Investigation Results — correlated risk events, network connections, and activity timelines for the investigated indicator.
Research Views
Deep-dive pages let you investigate individual entities in context using CIM data model correlation.
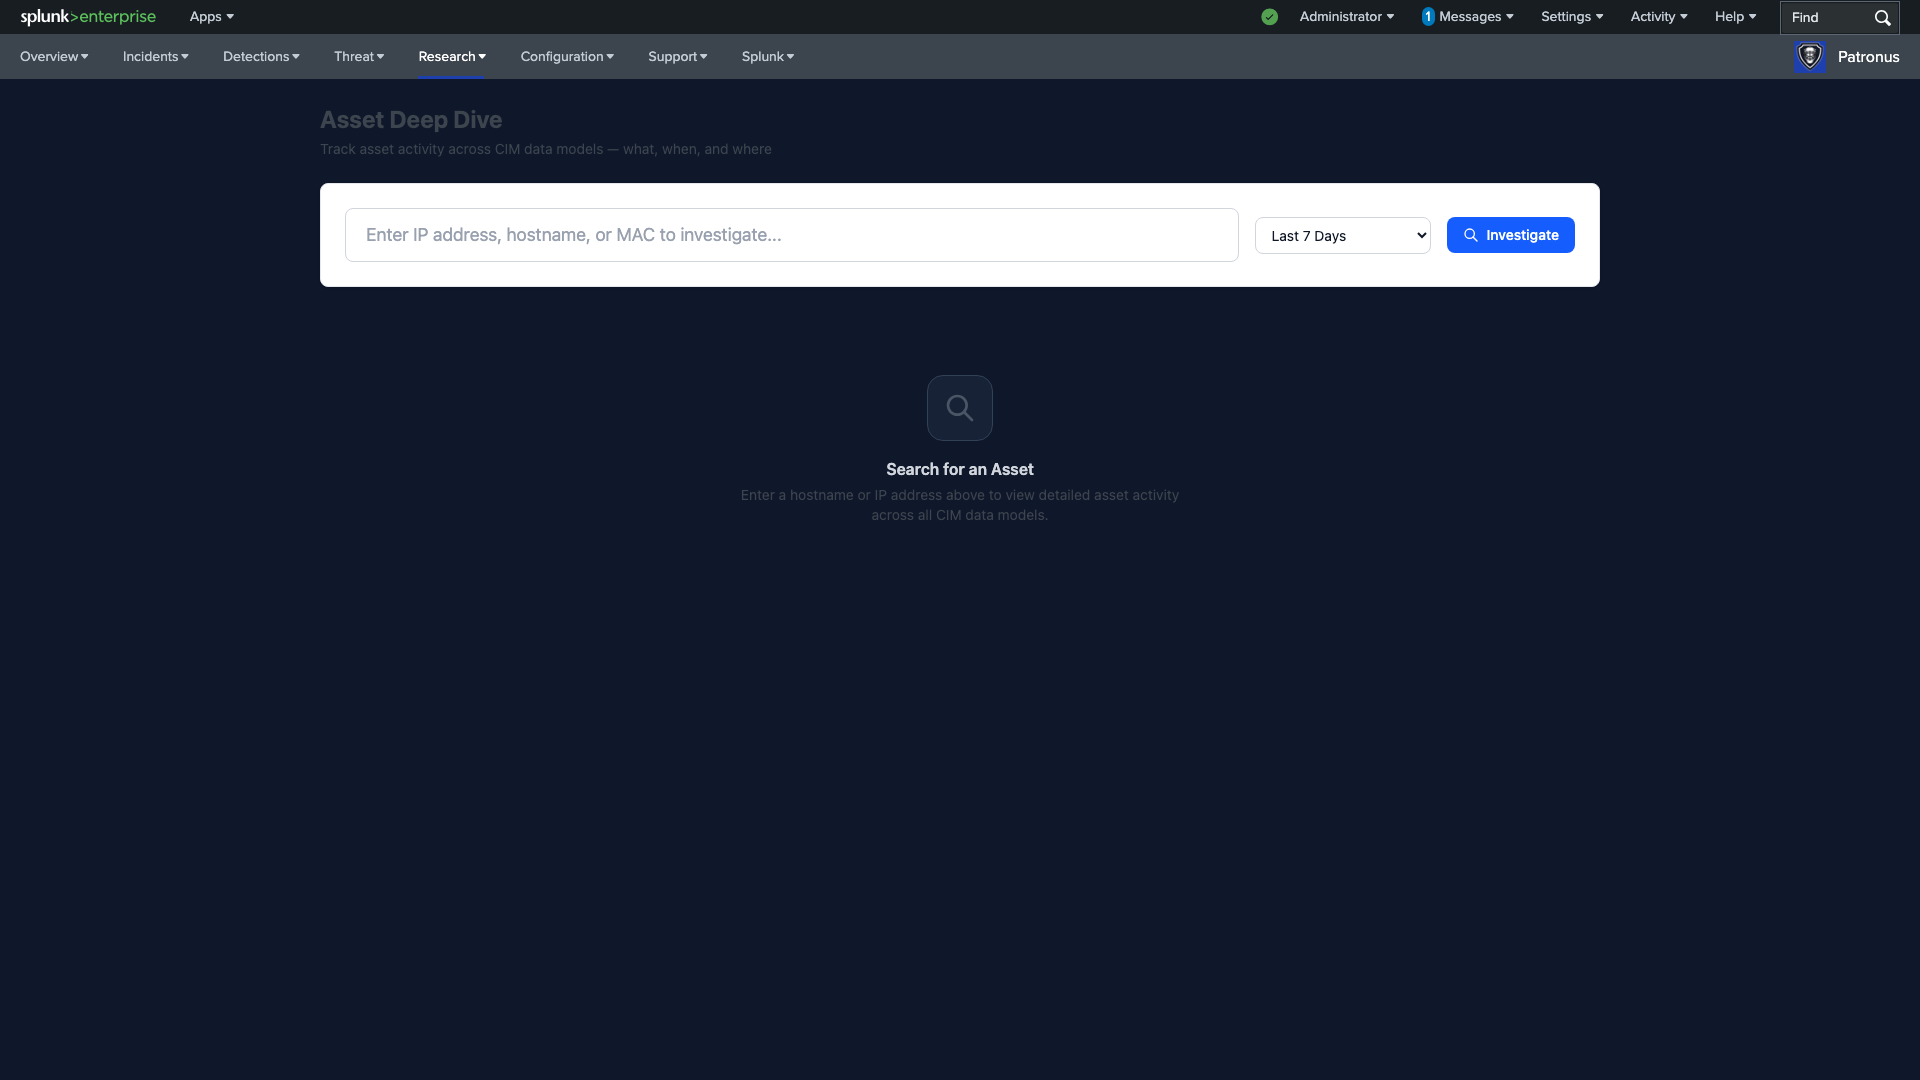
Asset Deep Dive
Search for any asset (by hostname, IP, or MAC address) to see:
- Asset Information — enriched metadata from the asset lookup (IP, DNS name, MAC, category, owner, priority).
- Activity KPIs — Total Events, Active Models (out of 5), Risk Score, Risk Events, Connections, First Seen, Last Seen.
- CIM Data Model Activity — swimlane visualization showing activity across Authentication, Endpoint, Network Traffic, Web, and IDS data models. Click any lane for detailed breakdowns.
- Combined Activity Timeline — multi-series area chart of all data model activity over time.
- Connection Analysis — network connections to and from the asset with port and protocol details.
Identity Deep Dive
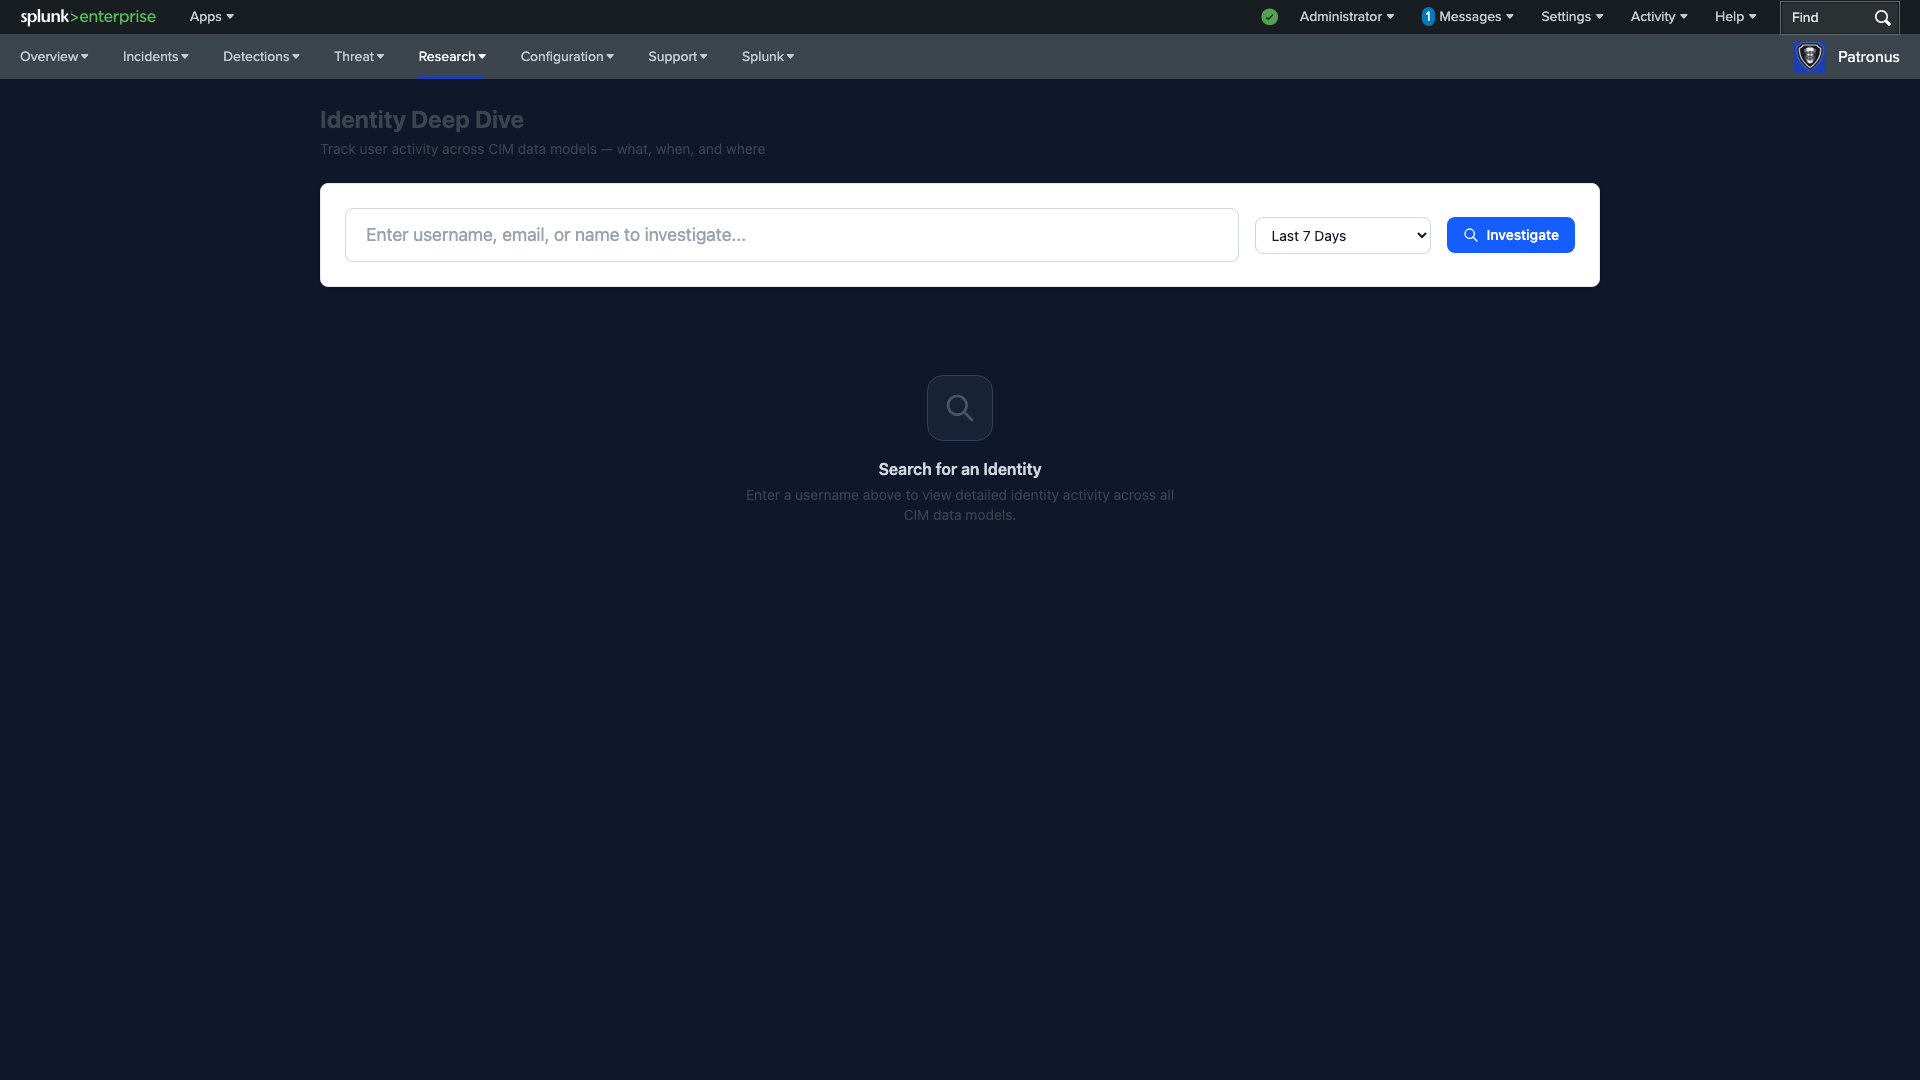
Search for any user identity (by username, email, or name) to see:
- Identity Information — enriched metadata from the identity lookup (username, name, email, manager, category, priority).
- Activity KPIs — Total Events, Active Models, Risk Score, Risk Events, Auth Events, Failed Logins, First Seen, Last Seen.
- CIM Data Model Activity — swimlane visualization with identity-focused data models.
- Combined Activity Timeline — multi-series area chart of all data model activity.
- Authentication Activity — login/logoff timeline with success/failure breakdown.
- Risk Events — all risk-generating events attributed to this identity.
Network
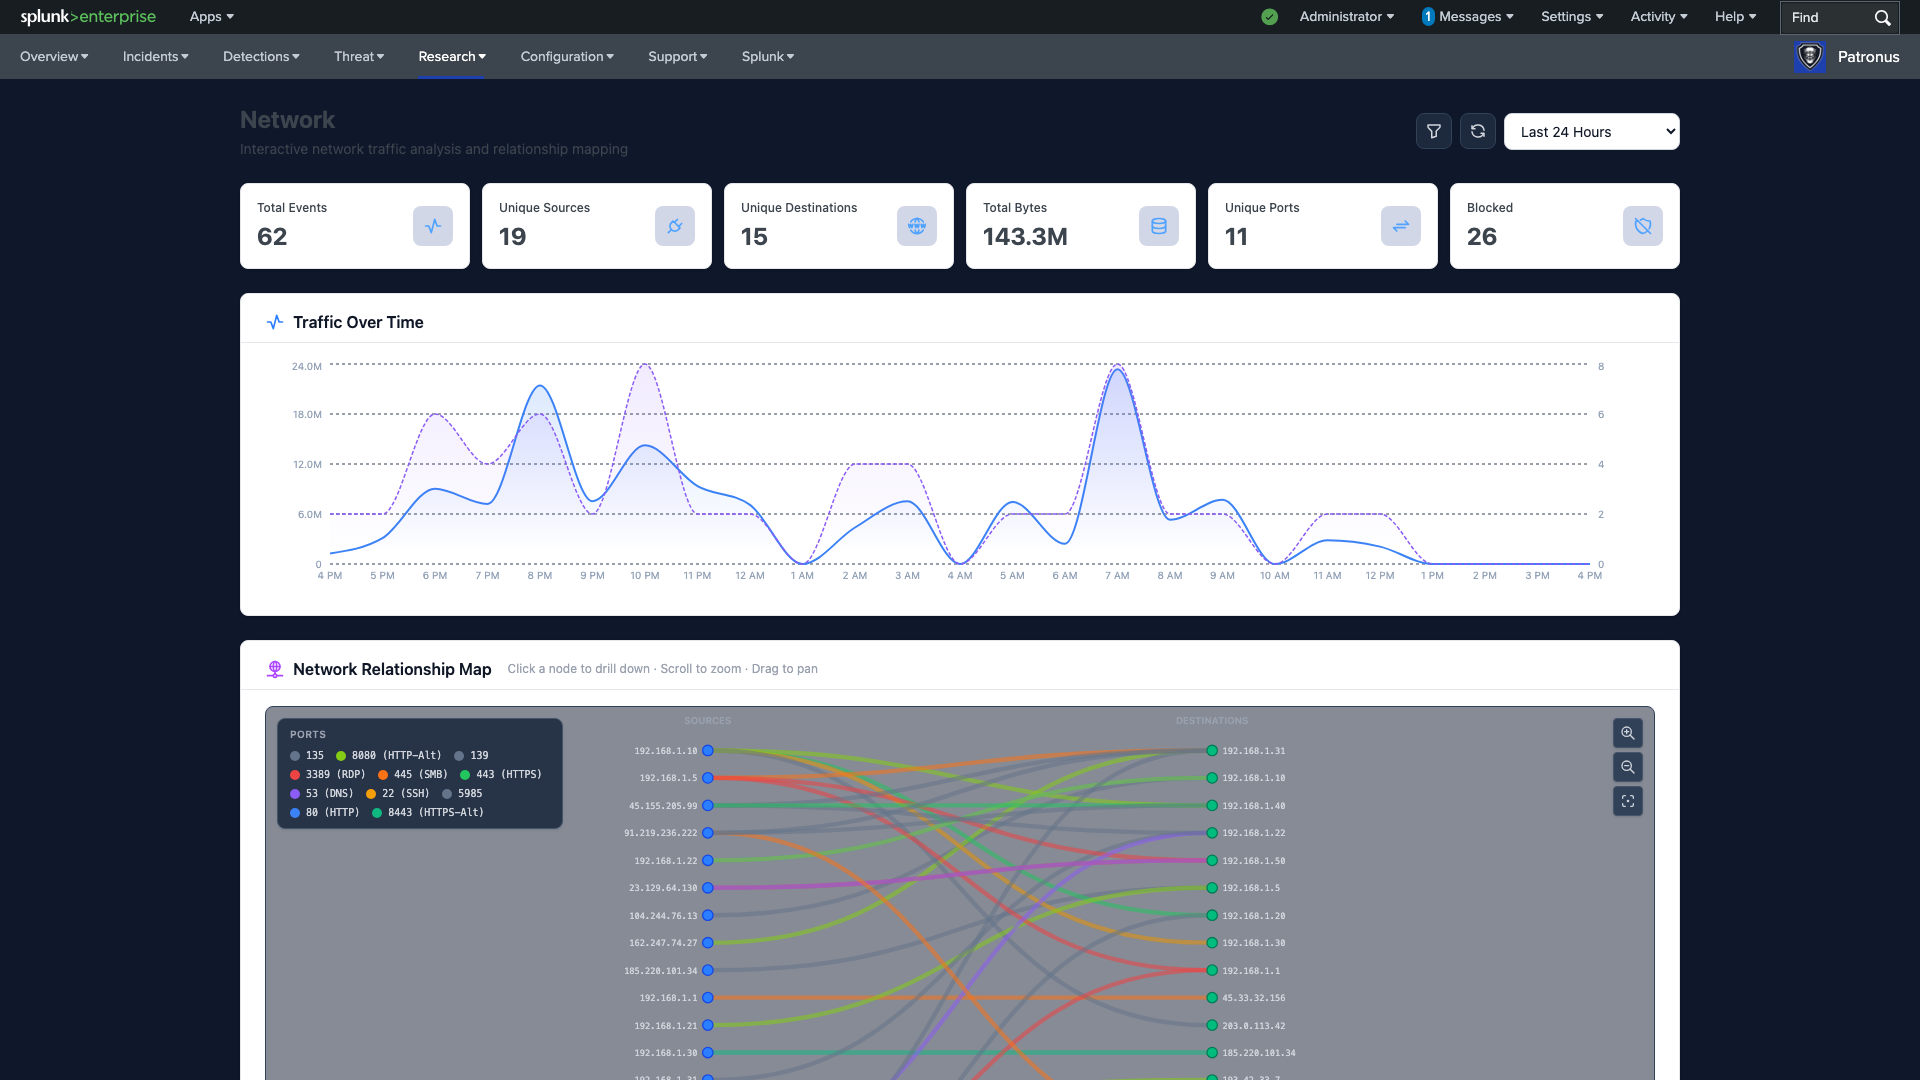
Interactive network traffic analysis and relationship mapping.
- Traffic KPIs — Total Events, Unique Sources, Unique Destinations, Total Bytes, Unique Ports, and Blocked connections.
- Traffic Over Time — dual-axis chart showing byte volume and event count trends.
- Network Relationship Map — interactive Sankey-style visualization showing connections between source IPs and destination IPs, color-coded by port/protocol. Click nodes to drill down, scroll to zoom, drag to pan.
- Top Talkers — ranked tables of top source and destination IPs by volume.
- Port Analysis — traffic distribution across ports and protocols.
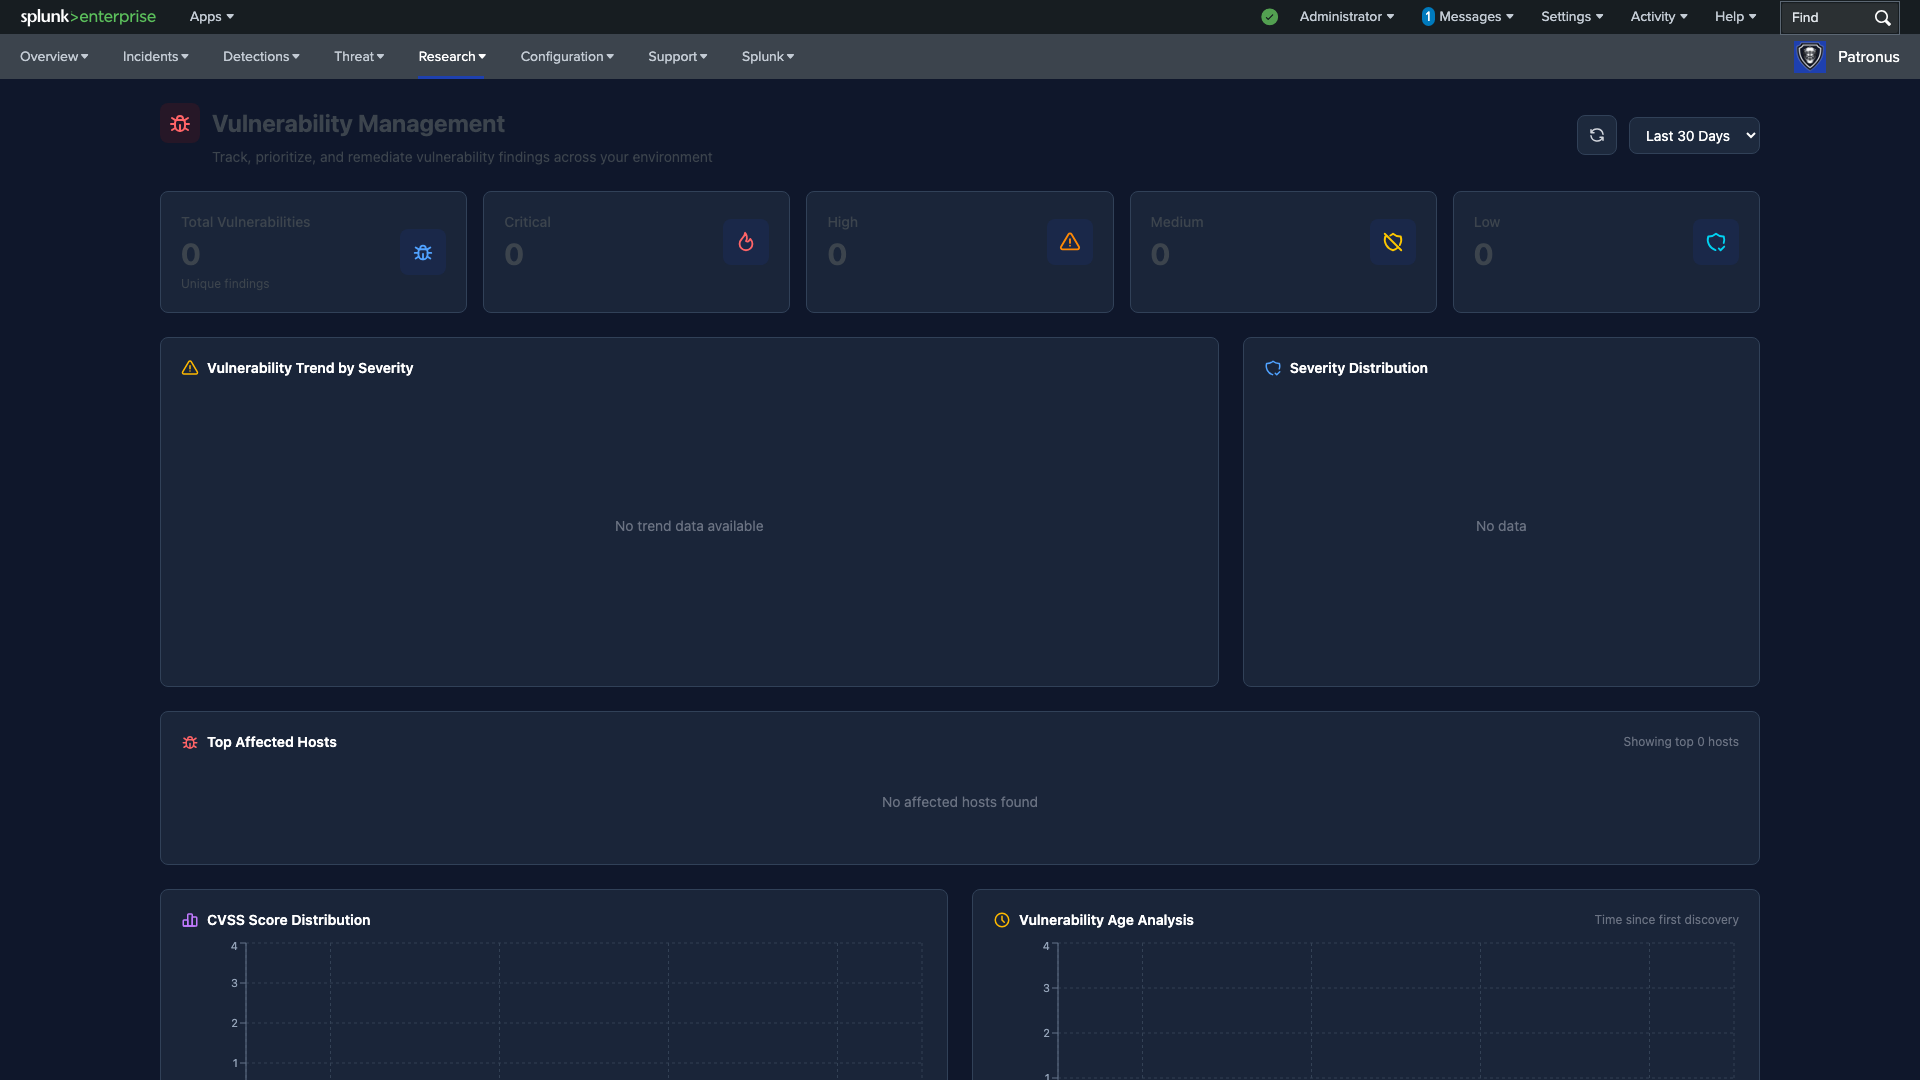
Vulnerability Management
Track, prioritize, and remediate vulnerability findings across your environment.
- Severity Cards — Total Vulnerabilities, Critical, High, Medium, Low with color-coded icons.
- Vulnerability Trend by Severity — stacked area chart showing severity distribution over time.
- Severity Distribution — pie chart breakdown.
- Top Affected Hosts — ranked list of hosts with the most vulnerability findings.
- CVSS Score Distribution and Vulnerability Age Analysis — bar charts for risk prioritization.
Configuration Management
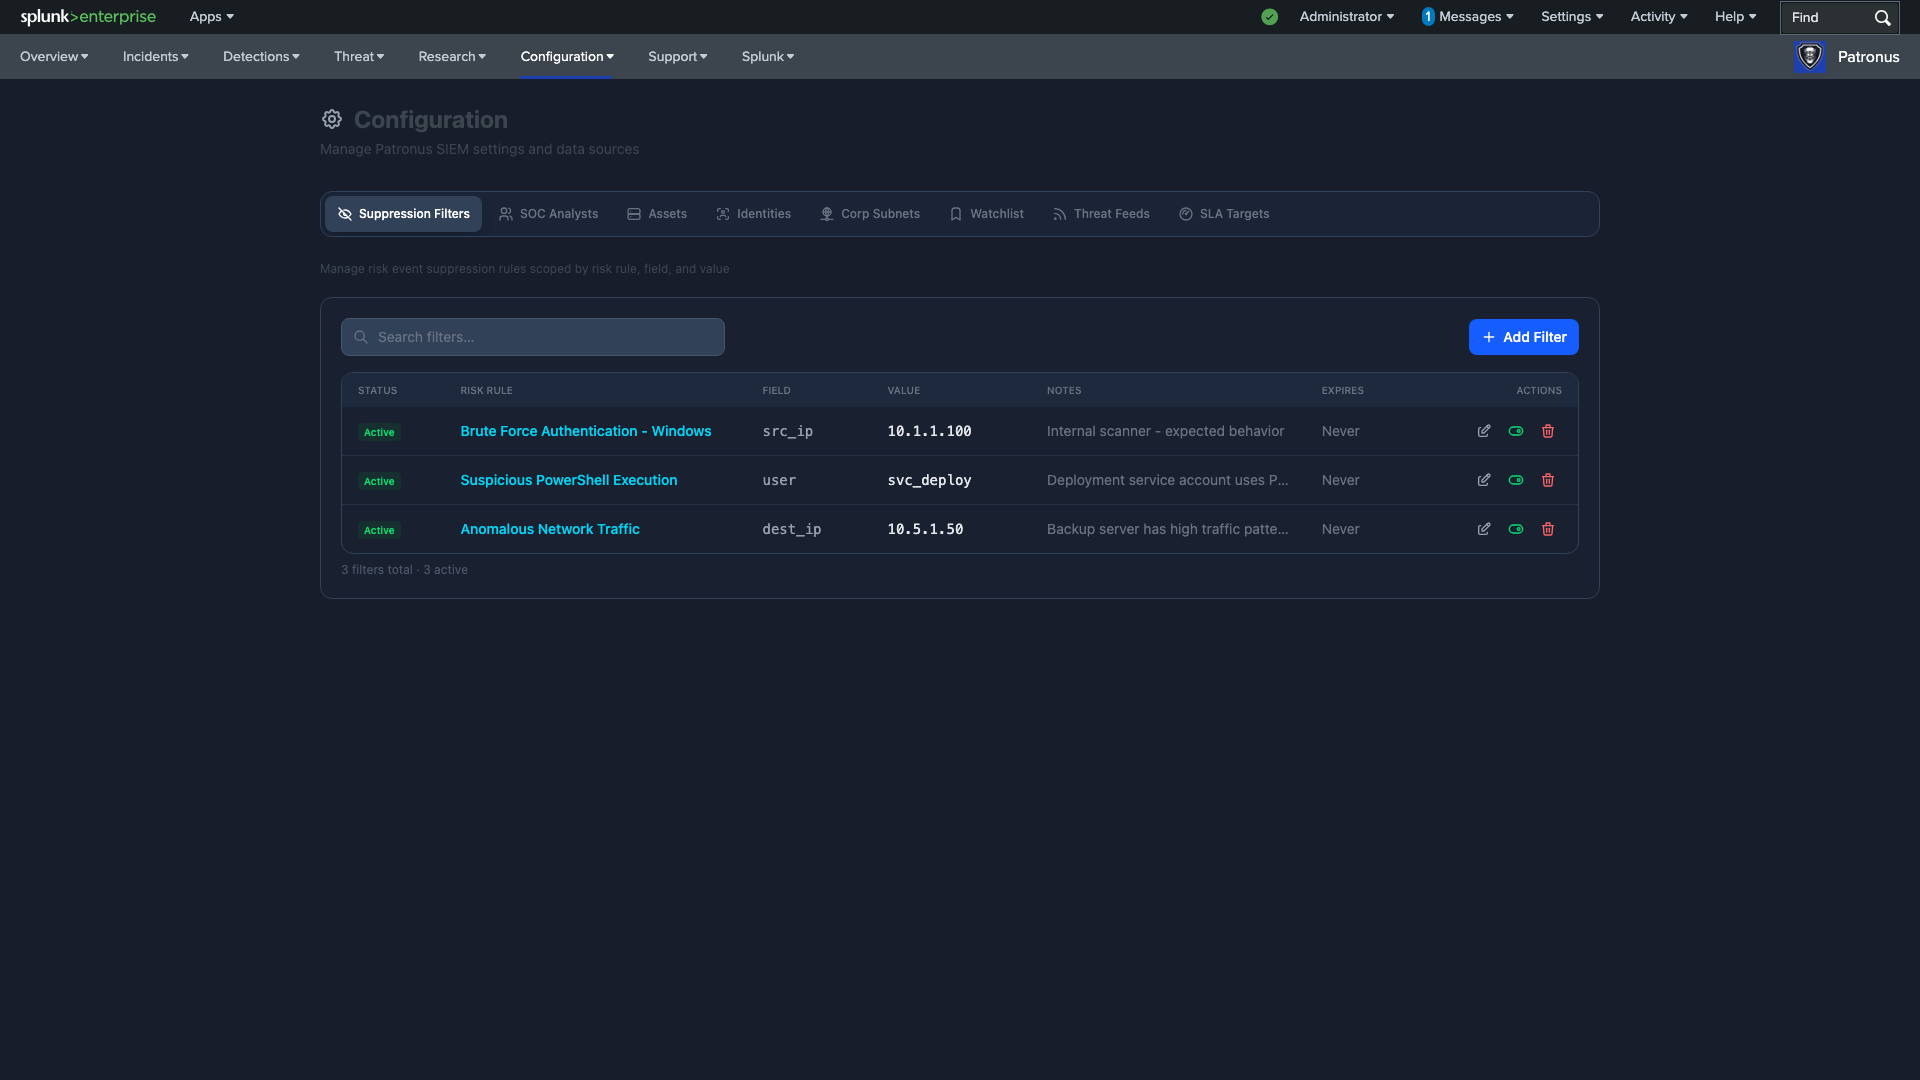
The Configuration page provides a unified tabbed interface for managing all Patronus SIEM settings.
- Suppression Filters — manage risk event suppression rules scoped by risk rule, field, and value. Each filter shows status, rule name, field, value, notes, and expiration.
- SOC Analysts — manage analyst roster for incident assignment.
- Assets — CRUD management for the asset inventory lookup (KVStore).
- Identities — CRUD management for the identity inventory lookup (KVStore).
- Corp Subnets — define internal network ranges in CIDR notation.
- Watchlist — manage high-priority risk object tracking.
- Threat Feeds — configure external threat intelligence sources.
- SLA Targets — configure MTTA and MTTR targets for SLA compliance tracking.
System Health
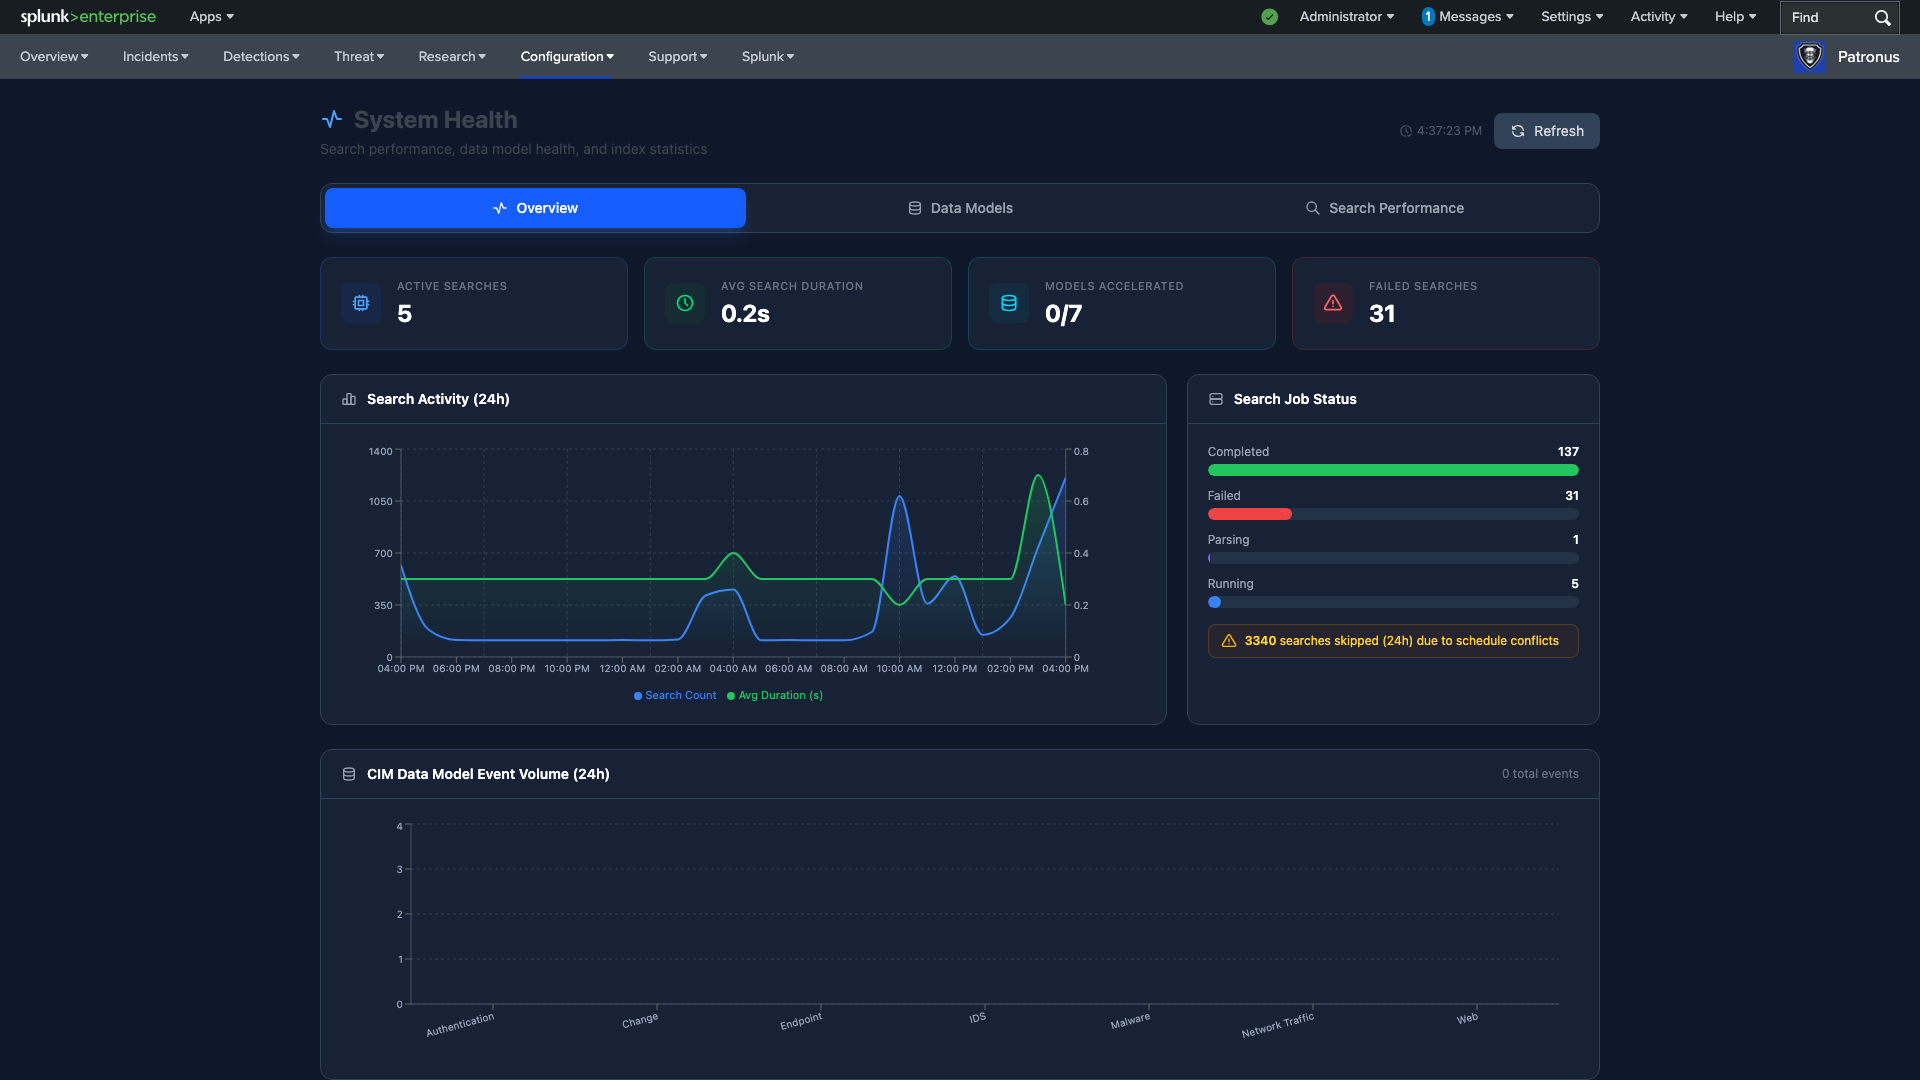
The System Health page helps you ensure Patronus is running efficiently with three tabs:
Overview
- KPIs — Active Searches, Avg Search Duration, Models Accelerated, Failed Searches.
- Search Activity (24h) — dual-axis chart showing search count and average duration.
- Search Job Status — horizontal bar chart with completed, failed, and running counts. Includes skipped search warnings due to schedule conflicts.
- CIM Data Model Event Volume — bar chart showing event counts across Authentication, Change, Endpoint, IDS, Malware, Network Traffic, and Web data models.
Data Models
- Acceleration status for each CIM data model.
- Size, event count, and time range coverage.
Search Performance
- Individual scheduled search run times and completion status.
- Identify slow or failing searches for tuning.
Tip: Check the System Health page weekly to catch issues before they affect dashboard load times or detection coverage. Pay attention to failed search counts and schedule conflict warnings.
Getting Help
If you encounter issues or have questions:
- Visit the Knowledge Base for troubleshooting guides and FAQs.
- Submit a ticket through the Support Portal.
- Email support@corporatemutt.com for direct assistance.