Workflows
This guide provides step-by-step operational workflows for every page in Patronus SIEM v2.0.0. Each section covers when to use a page, the recommended workflow, and key interactions to help you get the most out of the platform.
How to use this guide: Each workflow follows a numbered sequence of steps. Bold text indicates an action to take, followed by an explanation of what to look for. Workflows are organized by the navigation categories in the Patronus sidebar.
Overview
The Overview category provides high-level situational awareness, performance metrics, and shift management tools.
Executive Summary
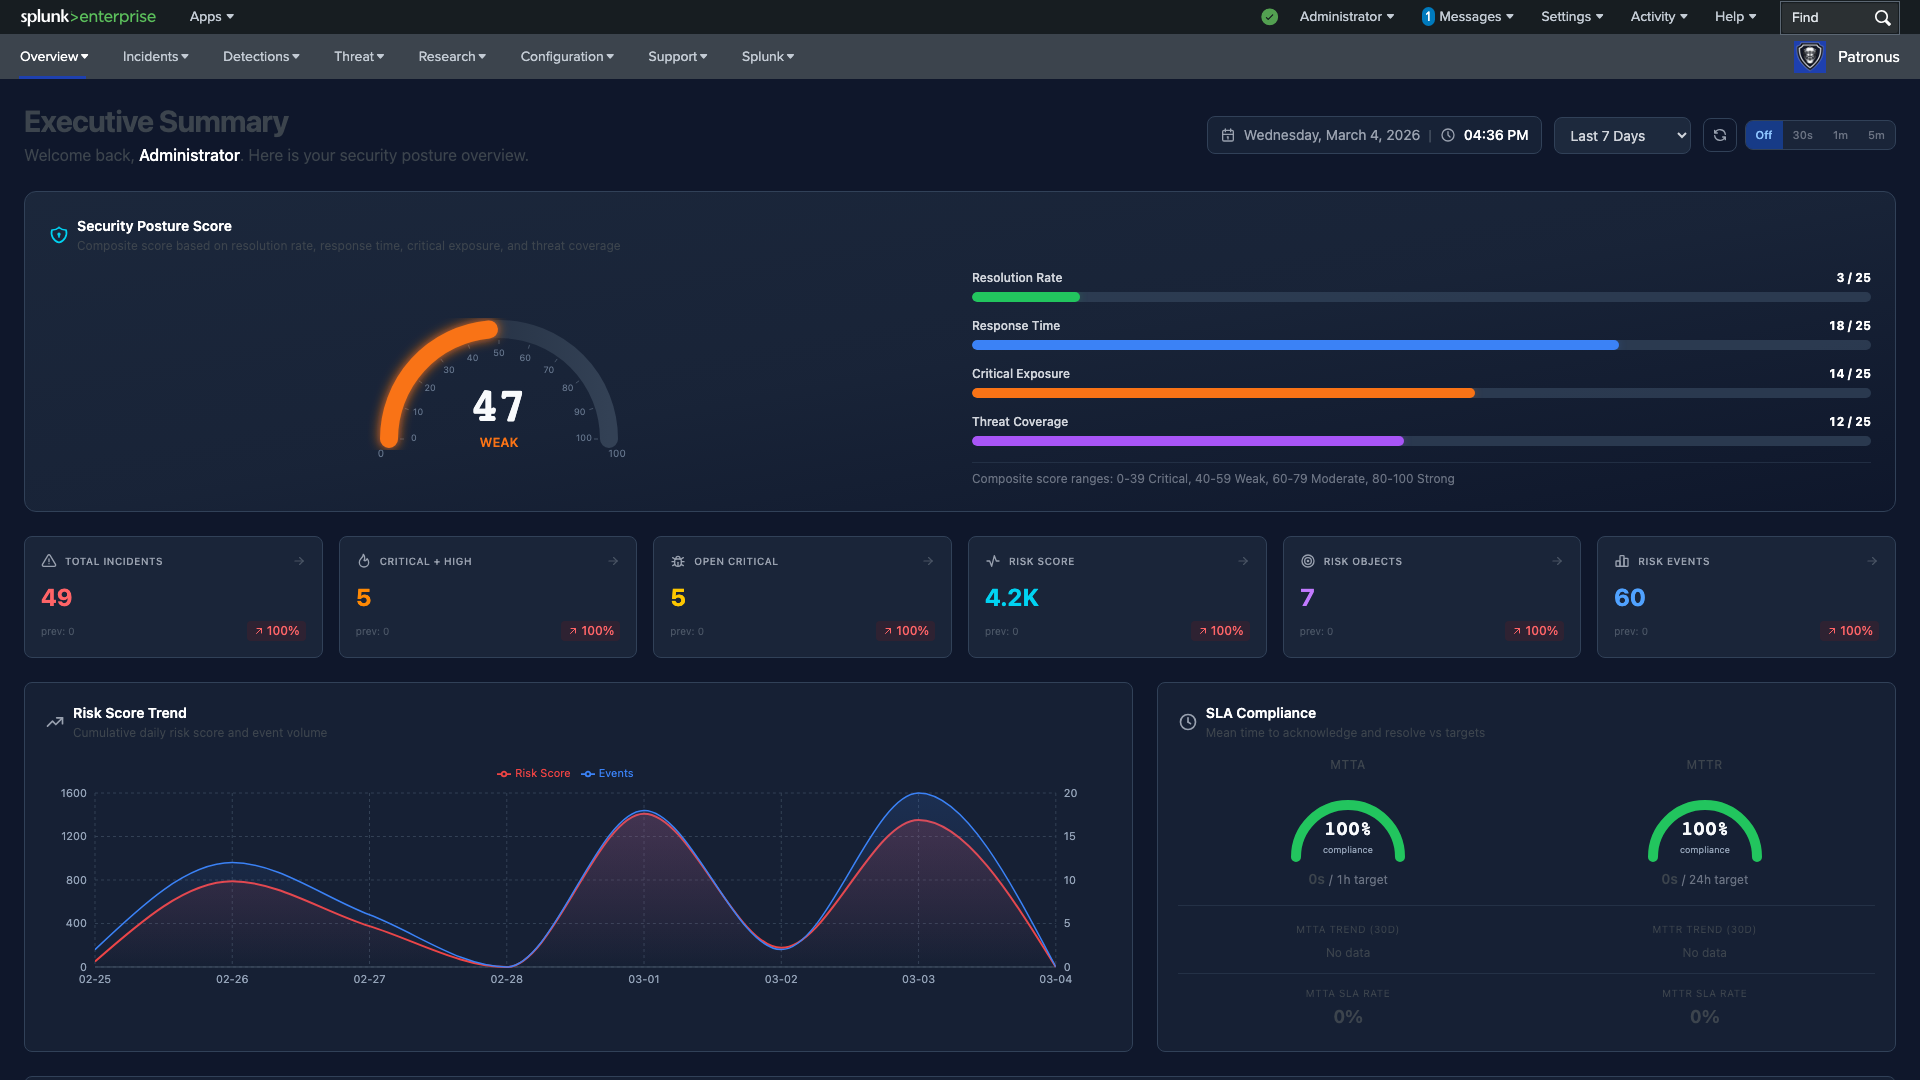
The Executive Summary is the default landing page and serves as the starting point for assessing your overall security posture at a glance.
When to use:
- At the start of every shift to assess the current state of your environment
- Before leadership briefings or status meetings to gather talking points
- Whenever you need a quick pulse check on security operations health
Workflow:
- Check the Security Posture Score — this composite gauge (0–100) reflects your overall security health. Scores are calculated from four factors: resolution rate, response time, critical exposure, and threat coverage (each worth up to 25 points). A score below 60 warrants immediate attention.
- Scan the KPI cards for trend indicators — each card (Total Incidents, Critical + High, Open Critical, Risk Score, Risk Objects, Risk Events) includes an up/down arrow showing the trend from the previous period. Red upward arrows on Critical or Risk Score indicate deteriorating conditions.
- Review the SLA Compliance gauges — check both MTTA (Mean Time to Acknowledge) and MTTR (Mean Time to Resolve) gauges. If either falls below your target threshold, look at the 30-day trend line to determine if the issue is a one-off or a worsening pattern.
- Examine the Incident Status Pipeline — this visual breakdown shows how incidents are distributed across lifecycle stages (New, Assigned, Working, Pending, Resolved, Closed). A large backlog in "New" or "Assigned" indicates triage isn't keeping up with volume.
- Review the Risk Score Trend chart — look for spikes in the cumulative daily risk score. Sudden jumps may indicate a new attack campaign or a misconfigured detection rule generating false positives.
- Scan the Threat Map — check for geographic clusters of threat intelligence matches. Unusual concentrations from unexpected regions may warrant further investigation.
- Drill down into areas of concern — click any KPI card to navigate directly to the corresponding detail view (e.g., clicking "Open Critical" takes you to the Incident Management page filtered to critical incidents).
Key interactions:
- Click any KPI card to drill down to the relevant detail page
- Hover over chart data points for exact values and timestamps
- Threat Map supports zoom and pan for geographic detail
Incident Metrics (Analysis)
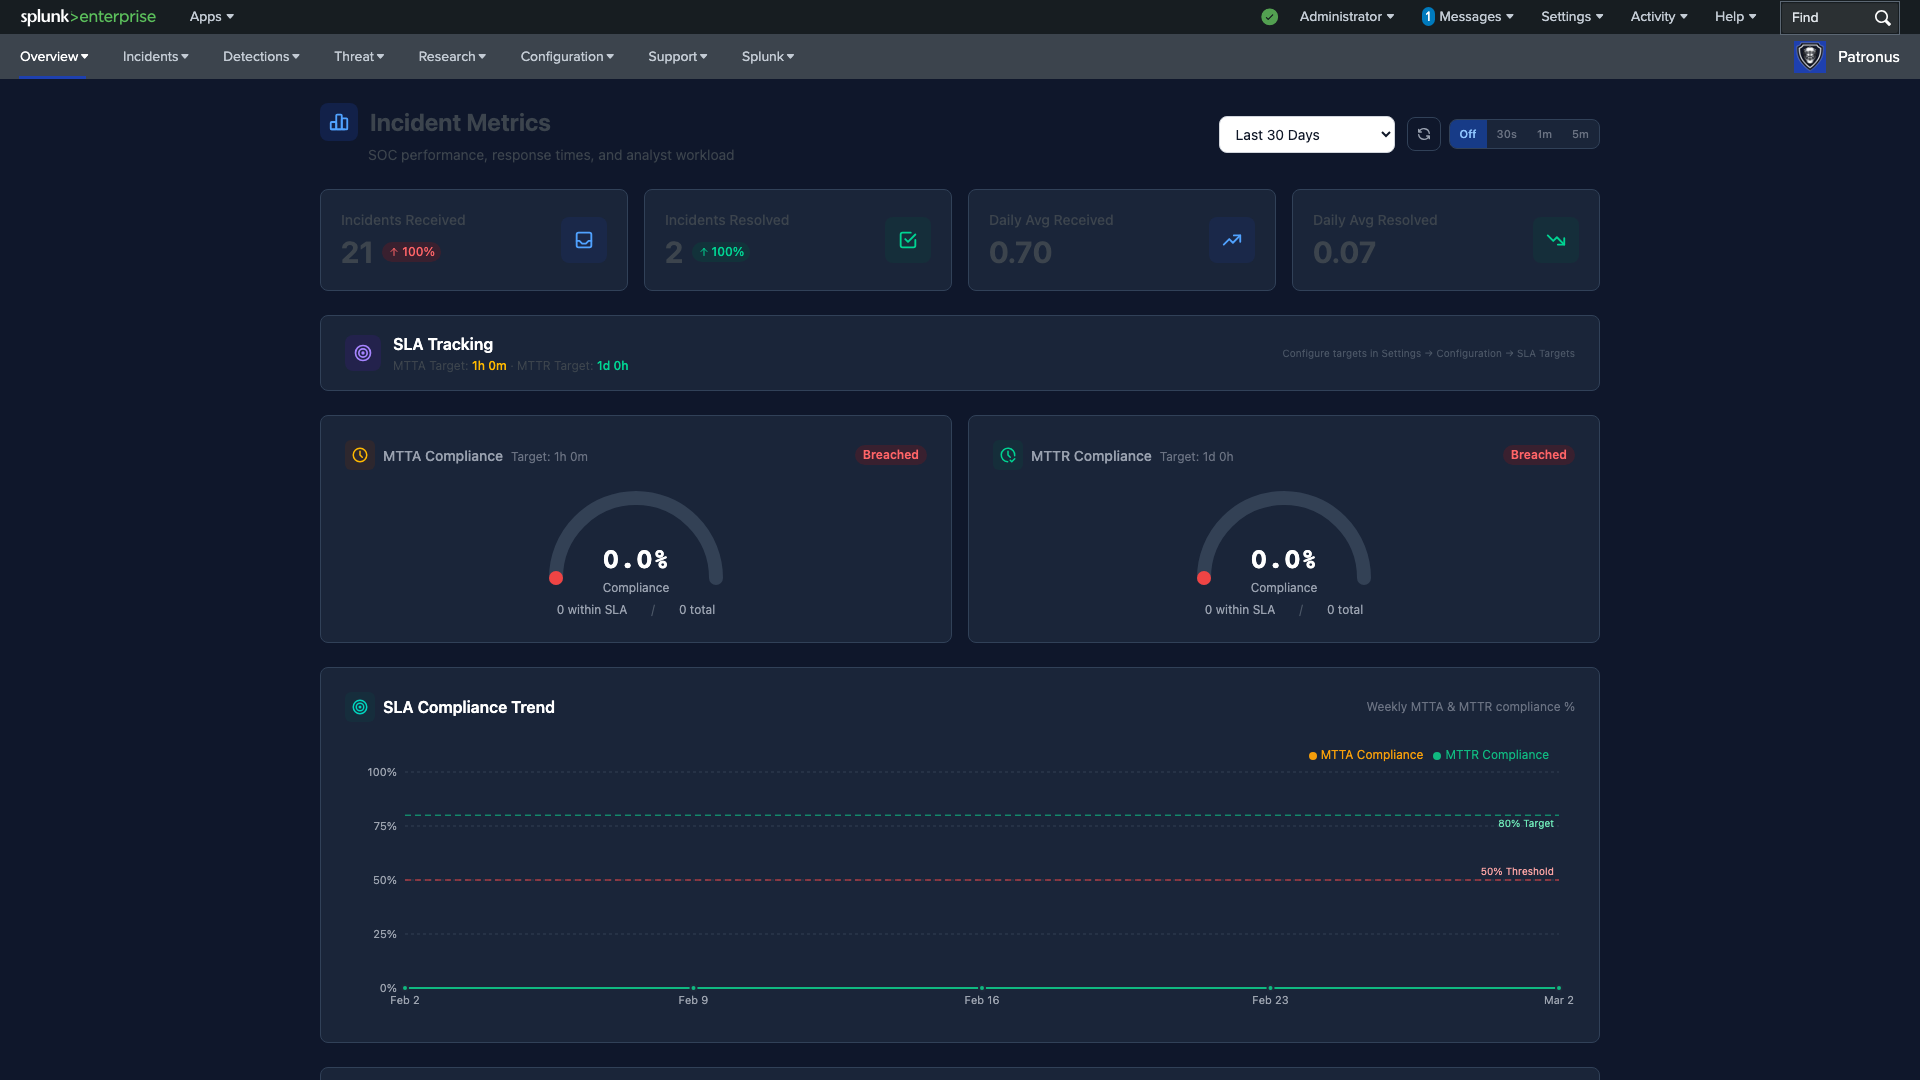
The Incident Metrics page provides SOC performance analytics with SLA tracking, analyst workload distribution, and trend analysis for operational reviews.
When to use:
- During weekly SOC performance reviews to assess team efficiency
- For SLA compliance reporting to management or clients
- When evaluating analyst workload balance and identifying bottlenecks
- To track improvement trends after process changes
Workflow:
- Review the KPI cards — check Incidents Received vs. Incidents Resolved for the selected time period. Compare Daily Avg Received to Daily Avg Resolved — if received consistently exceeds resolved, your team is falling behind.
- Check the MTTA and MTTR compliance gauges — these show current compliance percentages against your configured SLA targets. A "Breached" badge appears when compliance drops below the threshold. Click through to Configuration > SLA Targets to adjust thresholds if needed.
- Analyze the SLA Compliance Trend — this weekly chart shows MTTA and MTTR compliance over time with target and threshold reference lines. Look for downward trends that may indicate staffing issues or increasing incident complexity.
- Review the Incident Outlook chart — the created vs. resolved over-time comparison reveals whether you're trending toward resolution or accumulating a backlog.
- Examine the Analyst Performance Table — check per-analyst breakdowns of assigned incidents, resolution rates, and average response times. Identify analysts who may be overloaded (high assignment count, low resolution rate) or underutilized.
- Take action on findings — reassign incidents from overloaded analysts, update SLA targets if they're unrealistic, or escalate staffing concerns based on trend data.
Tip: Export this page's data weekly and track it in a spreadsheet to build long-term performance baselines. This helps set realistic SLA targets and justify staffing requests.
Shift Handoff
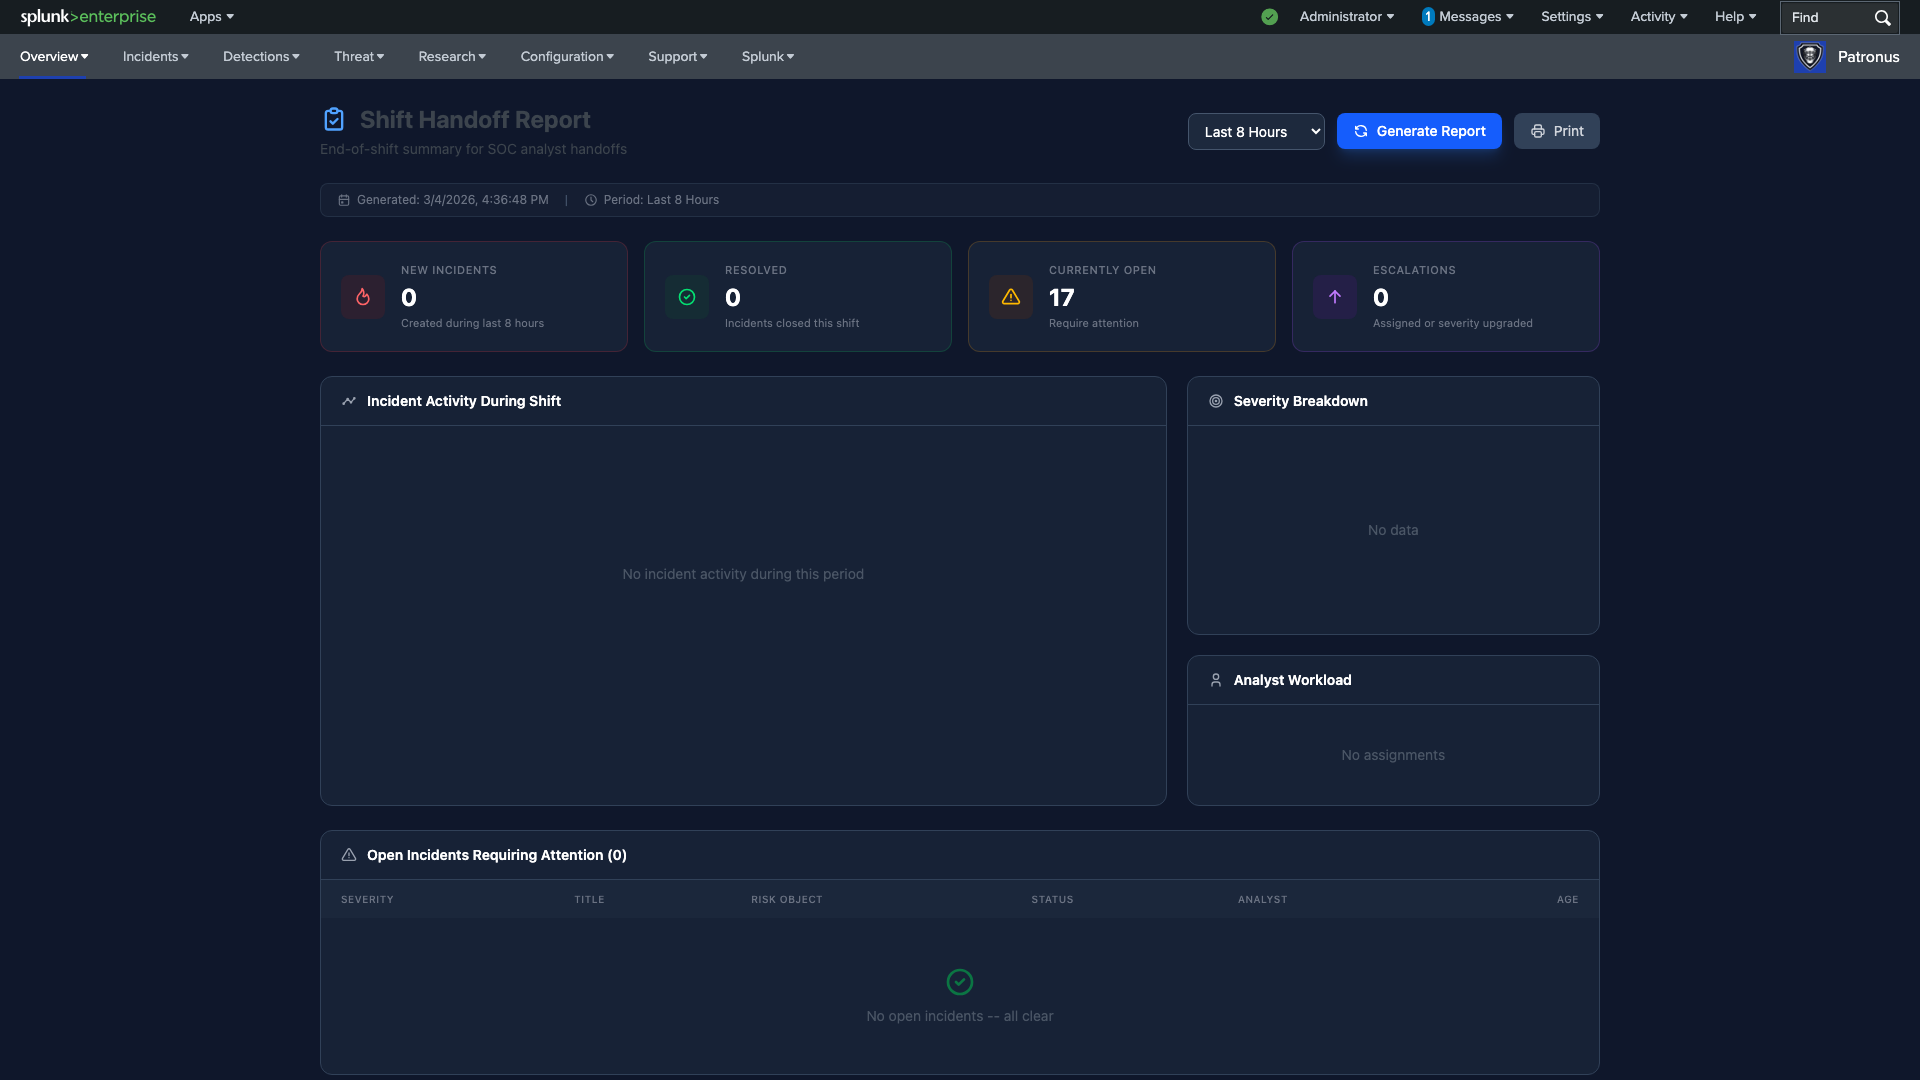
The Shift Handoff page generates structured end-of-shift reports to ensure smooth analyst transitions with full context on current operations.
When to use:
- At the end of every shift to prepare a handoff report for the incoming analyst
- During shift transitions to ensure continuity of ongoing investigations
- To document notable events or decisions made during a shift
Workflow:
- Select the shift period — choose Last 8 Hours, Last 12 Hours, or Last 24 Hours to match your shift duration. This filters all data on the page to your shift window.
- Review the Shift Summary KPIs — check New Incidents, Resolved, Currently Open, and Escalations that occurred during your shift. These numbers form the headline of your handoff.
- Check the Incident Activity timeline — review the creation and resolution pattern during your shift. Note any clusters of activity that the incoming analyst should be aware of.
- Review the Severity Breakdown — the pie chart shows the severity distribution of incidents during your shift. Highlight any critical or high-severity incidents in your handoff notes.
- Check Analyst Workload — review per-analyst assignment and resolution counts to understand who handled what during the shift.
- Review Open Incidents Requiring Attention — this table lists all unresolved incidents with severity, title, risk object, status, assigned analyst, and age. Flag any incidents that need immediate attention from the incoming team.
- Document Shift Notes — write detailed notes about ongoing investigations, decisions made, escalations, and anything the incoming analyst needs to know. Notes include timestamps and your name automatically for audit trail.
- Generate the Report — click "Generate Report" to create a formatted handoff document. Use the Print button if you need a physical copy or PDF.
Key interactions:
- Period selector filters all data on the page
- Shift Notes persist across sessions — they're saved automatically
- Generate Report and Print buttons at the top of the page
Incidents
The Incidents category provides tools for managing the full incident lifecycle from triage through resolution and reporting.
Incident Management
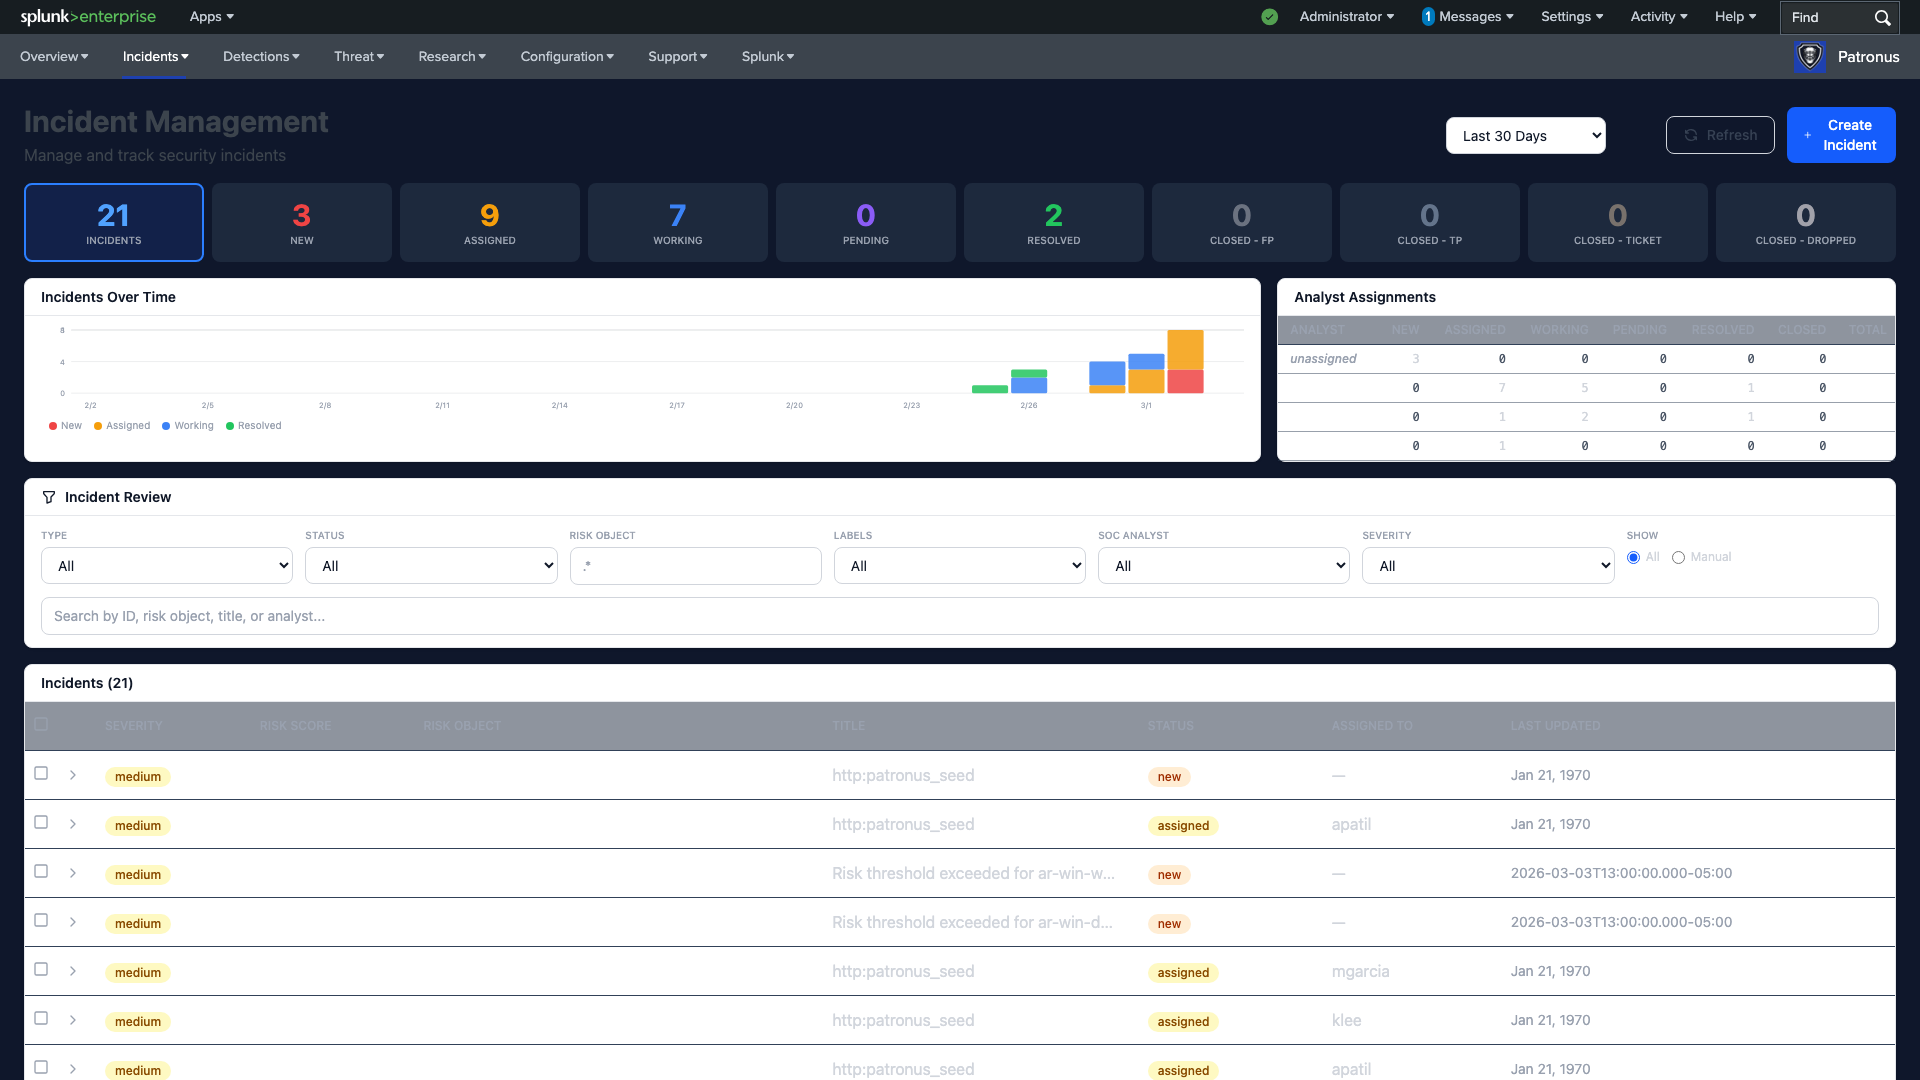
The Incident Management page is the central hub for security incident triage, investigation, and lifecycle management. This is where SOC analysts spend most of their day.
When to use:
- For daily incident triage and queue management
- When investigating a specific incident end-to-end
- To assign incidents to analysts and manage workload
- When you need to create a manual incident for an event not captured by automated detections
Workflow — Daily Triage:
- Review the Status Pipeline — the clickable cards across the top show incident counts at each lifecycle stage: New, Assigned, Working, Pending, Resolved, and various Closed dispositions (False Positive, True Positive, Ticket, Dropped). Start by noting the "New" count — these need immediate triage.
- Click the "New" pipeline card — this filters the incident table to show only untriaged incidents.
- Sort by severity — click the Severity column header to sort Critical and High incidents to the top.
- Apply additional filters as needed — use the filter controls to narrow by type, risk object, labels, or search by ID or title.
- Work through the queue — for each incident, follow the Investigation Workflow below.
Workflow — Individual Incident Investigation:
- Expand the incident row — click any row in the incident table to see the full incident detail panel inline.
- Review the risk timeline — this shows all detection events that contributed to this incident, ordered chronologically. Look for the initial trigger event and any escalation patterns.
- Examine risk objects — identify the users, hosts, and IP addresses involved. Multiple risk objects in a single incident may indicate lateral movement.
- Drill into individual events — click any detection event in the timeline to see the raw Splunk event data, including the full search result and original log.
- Deep-dive into entities — click asset or identity names to navigate to the Asset Deep Dive or Identity Deep Dive pages for full behavioral context around that entity.
- Add investigation notes — document your findings as you investigate. Notes include timestamps and your username for audit trail. Be specific — these notes inform the next analyst who touches this incident.
- Update the status — move the incident through the lifecycle: New → Assigned → Working → Pending → Resolved → Closed. Choose the appropriate disposition when closing (FP, TP, Ticket, Dropped).
- Assign an analyst — if the incident requires a specific skill set or needs to be escalated, assign or reassign to the appropriate SOC analyst from the dropdown.
Workflow — Creating a Manual Incident:
- Click "Create Incident" — use the button at the top of the page.
- Fill in the incident details — provide a descriptive title and detailed description. Manual incidents are useful for events observed outside of automated detection (e.g., threat intel reports, user-reported phishing).
- Assign and prioritize — set the severity and assign to an analyst immediately.
Important: Always add investigation notes before changing an incident's status. This ensures a complete audit trail and helps the next analyst understand your findings and reasoning.
Incident Report
The Incident Report page provides analytics dashboards and export capabilities for compliance reporting and management reviews.
When to use:
- For monthly or quarterly incident reporting to management
- During compliance audits that require incident volume and resolution metrics
- When preparing board-level security status summaries
Workflow:
- Set the time range — adjust the time picker to match your reporting period (e.g., last 30 days for a monthly report).
- Review the KPI Summary — note Total Incidents, New Today, Resolved Today, Open count, Average Risk Score, and Average Event Count. These are your headline metrics.
- Check MTTR and Resolution Rate — the Mean Time to Resolve and Resolution Rate visual indicators tell you how efficiently your team is operating.
- Analyze the Incident Trend chart — the New vs. Resolved stacked area chart shows whether you're gaining or losing ground over the reporting period. A widening gap between new and resolved indicates growing backlog.
- Review the Cumulative Open Incidents chart — this running total shows the trajectory of unresolved incidents. An upward trend requires action.
- Examine Distribution Charts — the Status, Severity, and Incidents by Type breakdowns reveal patterns in your incident portfolio.
- Export for stakeholders — use the Print or CSV export options to generate reports for distribution. Print mode formats the page for clean output.
Tip: Run this report on the first business day of each month with a "Last 30 Days" time range. This creates a consistent reporting cadence and makes trend comparisons straightforward.
Detections
The Detections category provides risk scoring, ATT&CK coverage mapping, and detection rule management for security operations.
Risk Scoreboard
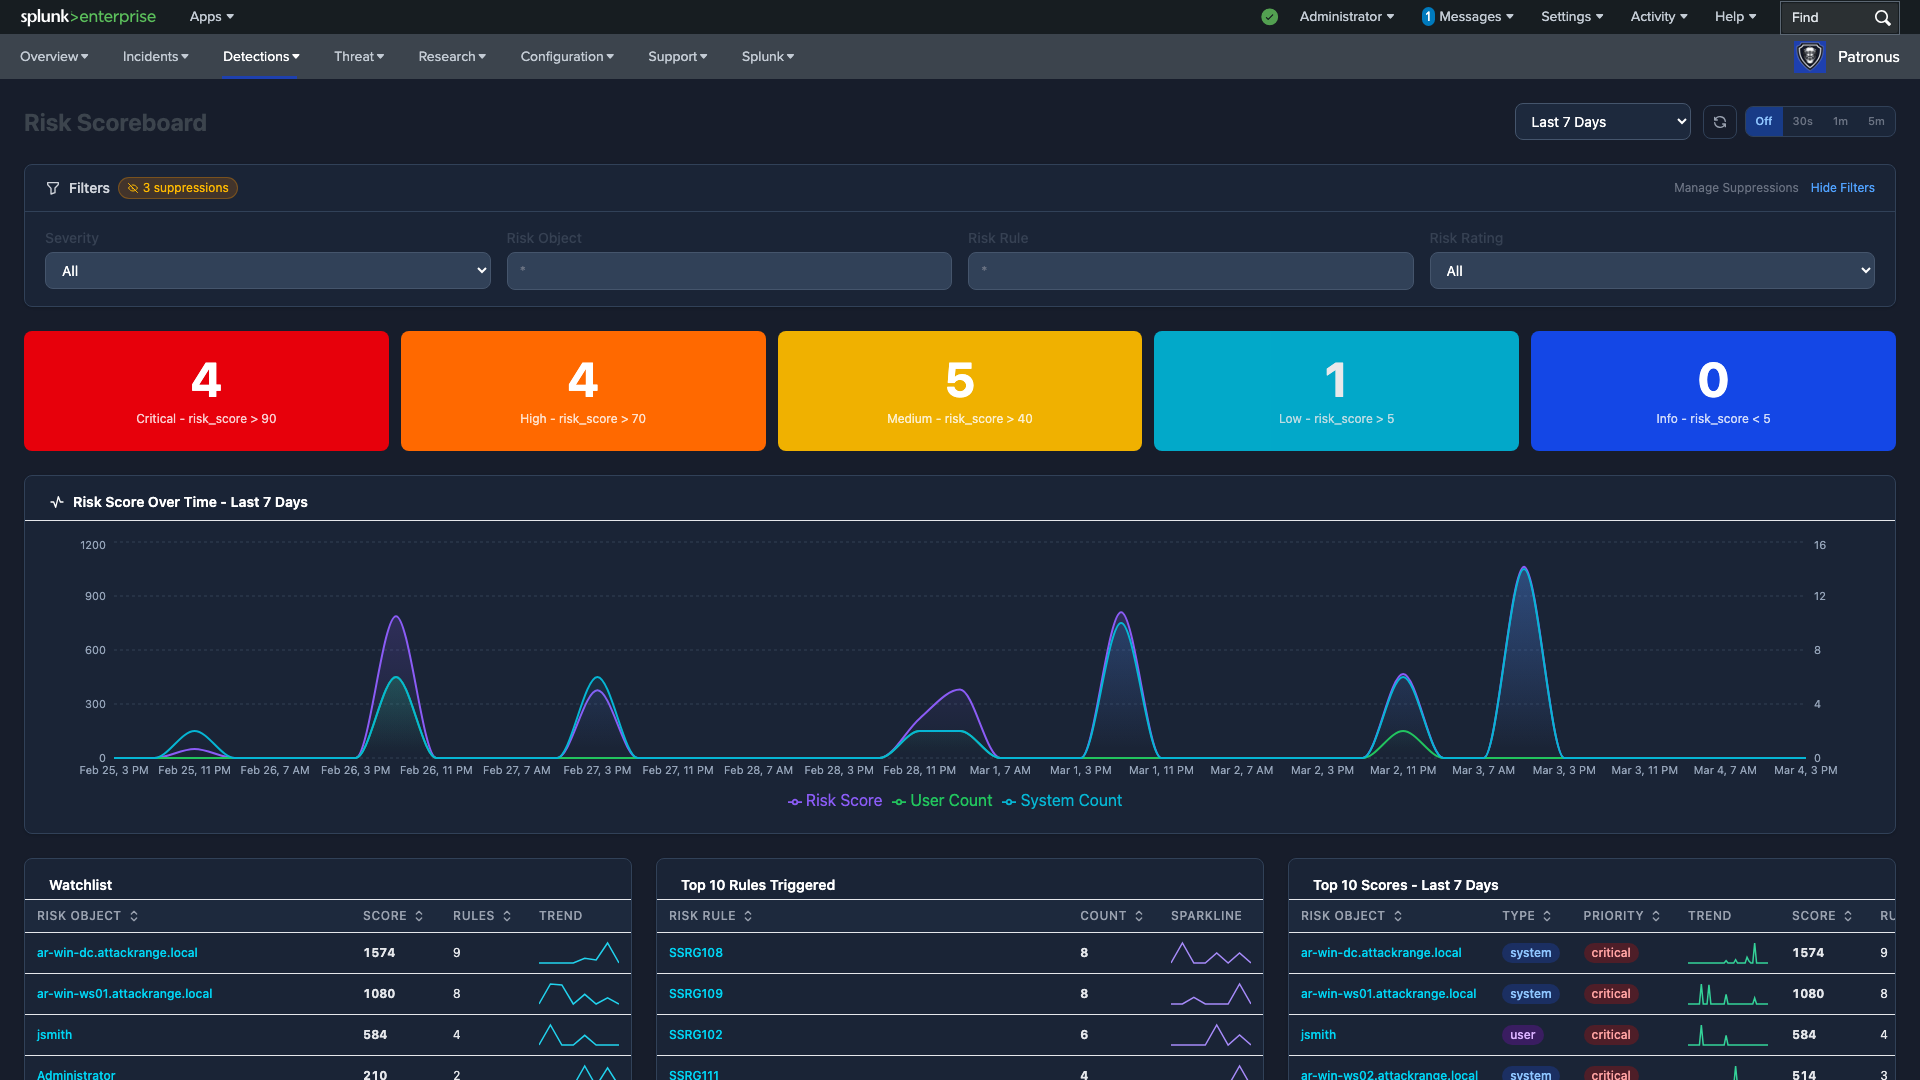
The Scoreboard is the primary real-time operational view for SOC analysts. It aggregates risk scores across all entities and shows which users, hosts, and IPs require immediate attention.
When to use:
- Continuously during your shift for real-time risk monitoring
- When prioritizing which entities to investigate first
- After a detection rule fires, to see the cumulative risk impact
- To monitor watchlisted entities for unusual activity
Workflow:
- Scan the severity cards — the color-coded counters (Critical, High, Medium, Low, Info) show how many risk objects are at each severity level. Focus on Critical (red) and High (orange) first.
- Check the Risk Score Over Time chart — this dual-axis area chart shows cumulative risk score alongside user and system counts. Look for sudden spikes that indicate a burst of risk-generating activity.
- Review the Top 10 Scores — this entity leaderboard shows the highest-risk objects with their type, priority badge, trend sparklines, score, and rule count. Entities near the top are your investigation priorities.
- Click on a high-risk entity — this opens a detailed timeline of all risk-generating events for that entity, helping you understand what triggered the score.
- Check the Top 10 Rules Triggered — the ranked bar chart shows which detection rules are firing most frequently. A single rule dominating the chart may indicate a tuning issue or an active attack.
- Review the Watchlist — this sortable table shows tracked entities with score, rule count, and inline sparklines. Watchlisted entities are those you've flagged for continuous monitoring.
- Apply filters for focused analysis — use the interactive filters to narrow by severity, risk object, risk rule, or risk rating. This helps you focus on specific categories during investigation.
- Navigate to deep-dive pages — for any entity of interest, navigate to the Asset Deep Dive (for hosts/IPs) or Identity Deep Dive (for users) to see full behavioral context.
Key interactions:
- Click severity cards to filter the table to that severity level
- Click entity rows for event detail timelines
- Sparklines in table rows show 7-day trend direction
- Suppression count badge links to suppression filter management
MITRE ATT&CK Coverage
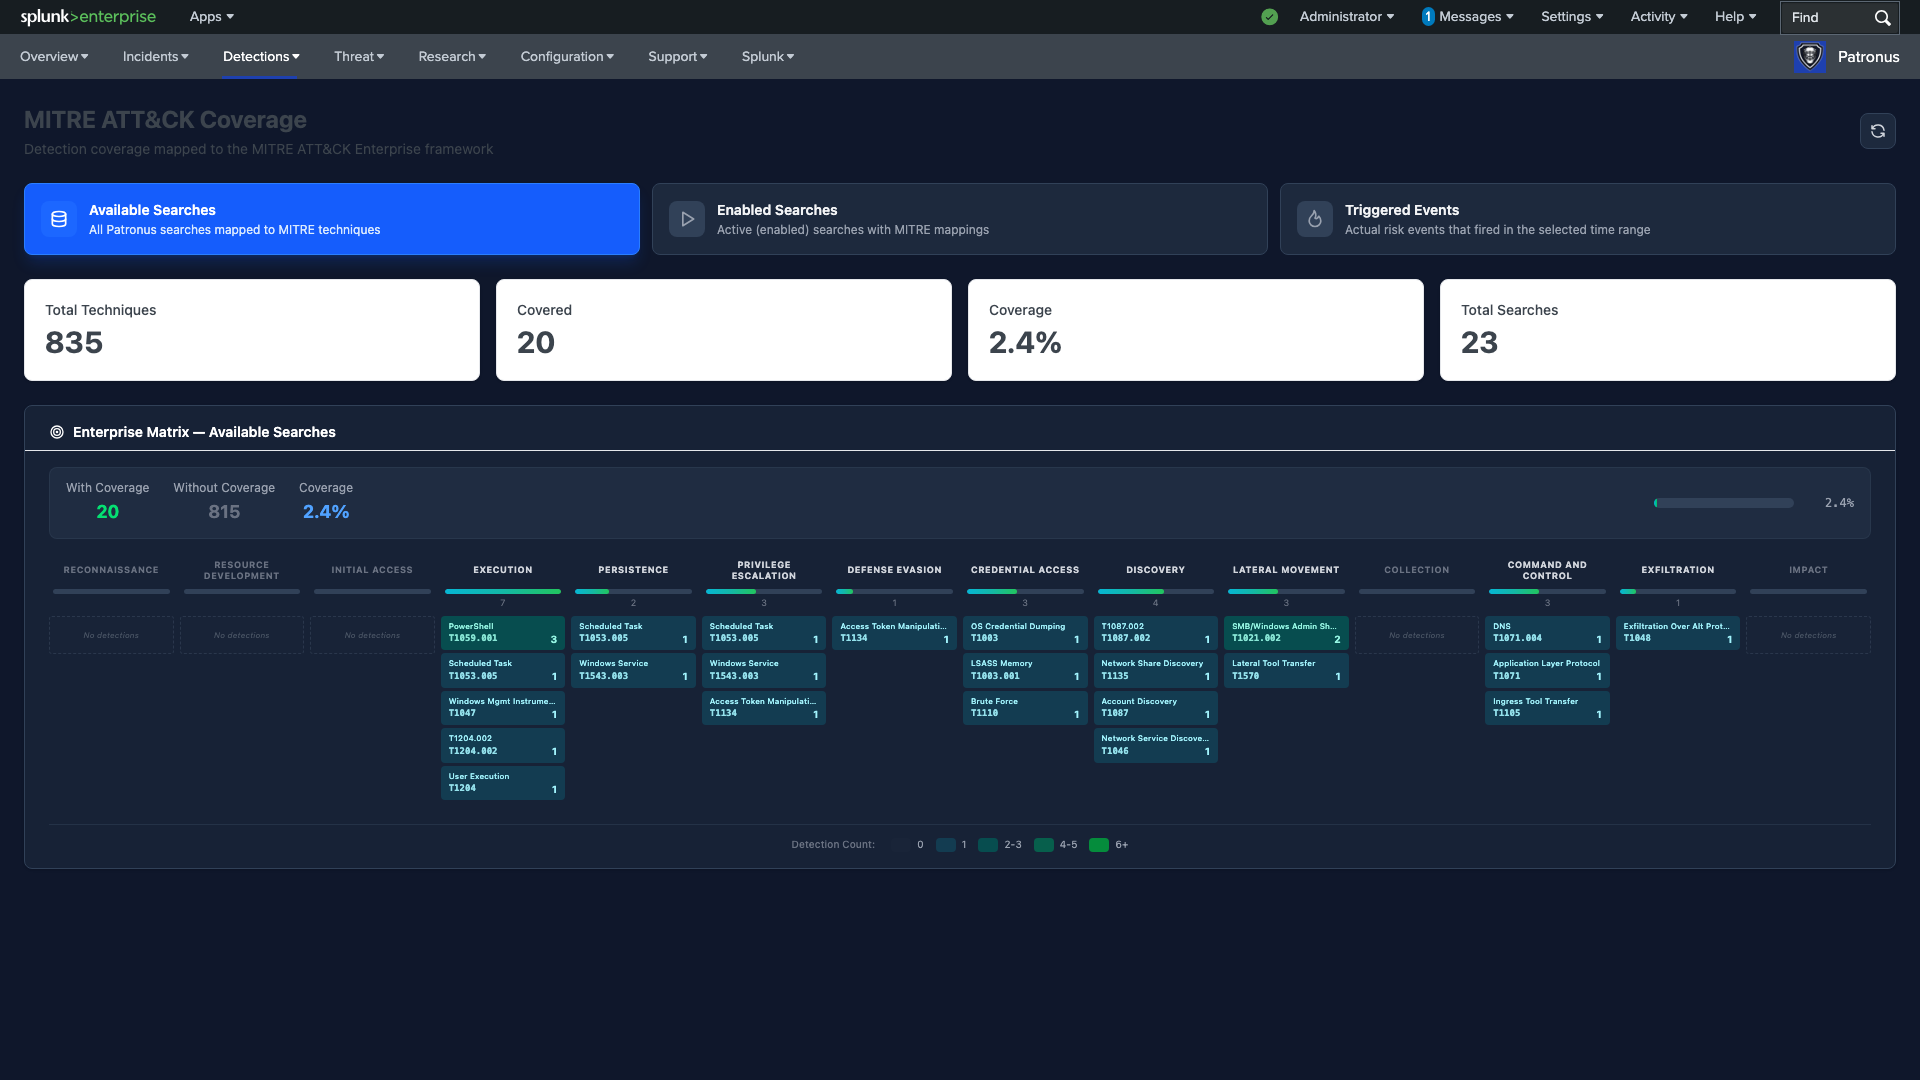
The MITRE ATT&CK page maps your detection capabilities against the Enterprise ATT&CK framework, helping you identify coverage gaps and plan detection engineering priorities.
When to use:
- During detection engineering planning to identify coverage gaps
- For compliance assessments that require ATT&CK coverage reporting
- When evaluating the effectiveness of your detection program
- After deploying new detection rules to verify coverage improvement
Workflow:
- Start with "Available Searches" mode — this shows all saved searches that are mapped to MITRE techniques, giving you a view of your total potential coverage.
- Review the coverage statistics — note Total Techniques, Covered count, Coverage percentage, and Total Searches. This is your baseline detection coverage.
- Scan the Enterprise Matrix for gaps — techniques appear as colored tiles within tactic columns. Gray or empty tiles represent coverage gaps. Color intensity indicates detection density: lighter shades mean fewer rules (1), darker shades mean more (6+).
- Switch to "Enabled Searches" — this filters to only active (enabled) detection rules. The difference between Available and Enabled coverage reveals rules that exist but aren't running.
- Switch to "Triggered Events" — this shows actual risk events that fired in the selected time range. This is your real-world, empirical coverage — the techniques where detections have actually triggered. Compare this to Available coverage to find rules that haven't triggered (either because the threat hasn't appeared or the rule needs tuning).
- Click a technique tile — this reveals which specific detection rules provide coverage for that technique. Use this to understand what's protecting each technique.
- Identify tactics with low coverage — scan across tactic columns (Initial Access, Execution, Persistence, etc.) and note which have the fewest covered techniques.
- Plan detection engineering priorities — based on your gap analysis, create a prioritized list of techniques to build new detections for, focusing on high-impact tactics first.
Tip: Run the matrix in "Triggered Events" mode monthly and compare coverage percentages over time. This measures the real-world effectiveness of your detection program, not just what's theoretically available.
Hunt Library
The Hunt Library is your detection catalog — a browsable inventory of all detection rules with MITRE mapping, operational controls, and coverage analytics.
When to use:
- When managing detection rules (enabling, disabling, scheduling)
- During detection engineering to review and tune existing rules
- When investigating which rules map to a specific MITRE technique
- For auditing detection coverage by data source or tactic
Workflow — Rule Review:
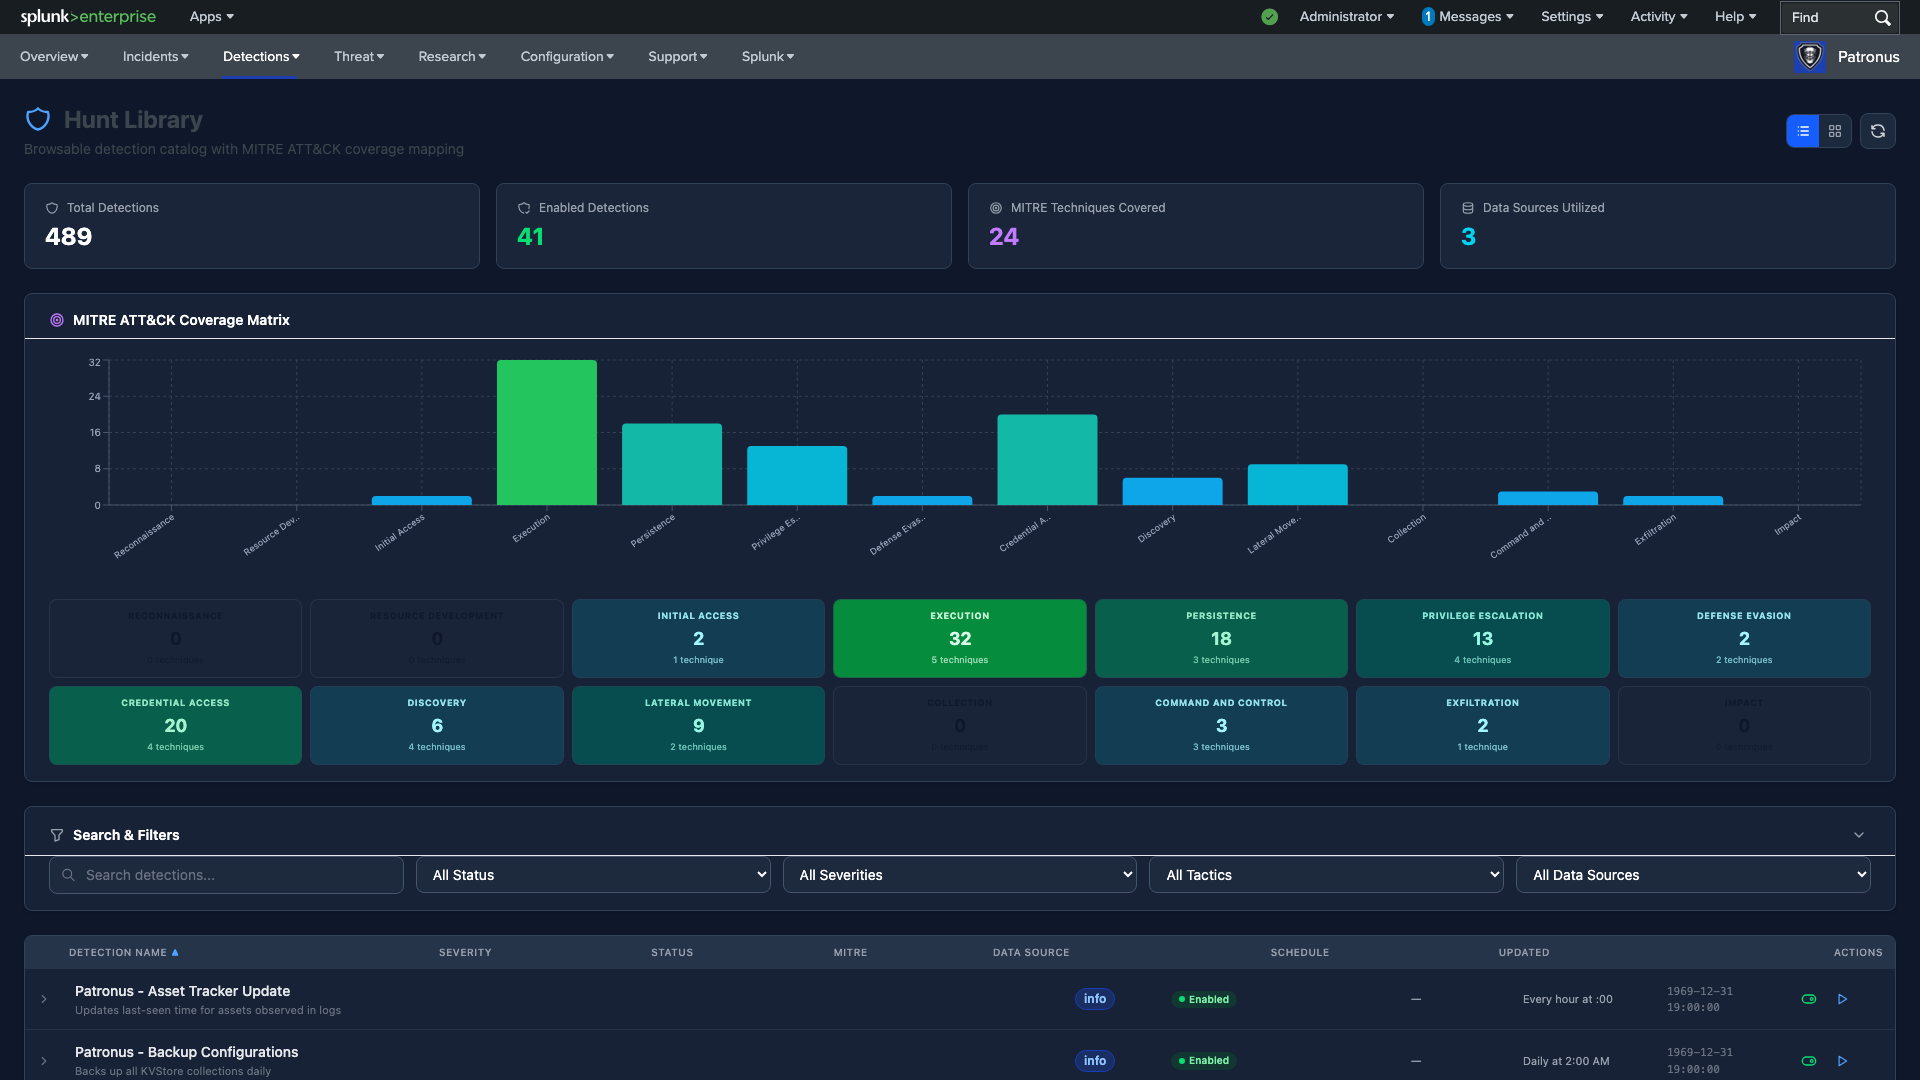
- Review the detection KPIs — check Total Detections, Enabled Detections, MITRE Techniques Covered, and Data Sources Utilized. A low enabled-to-total ratio means you have unused detection capacity.
- Check the MITRE ATT&CK Coverage bar chart — this shows detection count per tactic with tactic summary cards showing technique counts. Identify tactics with minimal detection coverage.
- Browse the Detection Table — each row shows the rule name, severity badge, enabled/disabled status, MITRE technique tags, data source, schedule, and last updated timestamp.
- Filter to focus your review — use the search bar to find rules by name, or use the dropdown filters for status (enabled/disabled), severity, tactic, or data source.
- Expand a row for details — click any rule to see its full description, search query, and configuration.
Workflow — Enabling/Disabling Rules:
- Find the target rule — use search or filters to locate the detection rule you want to modify.
- Toggle the enable/disable switch — this immediately activates or deactivates the rule's scheduled execution.
- Use "Run Now" for one-time execution — click the Run Now button to manually dispatch any detection rule, even if it's currently disabled. Patronus will temporarily enable the search, dispatch it, and re-disable it automatically.
Workflow — MITRE Mapping:
- Expand a detection row — click a rule that needs MITRE technique assignment.
- Open the MITRE Mapping Editor — the inline editor allows you to assign or update MITRE technique IDs.
- Enter technique IDs — use pipe-separated values (e.g.,
T1059.001|T1059.003) for multiple techniques. - Save changes — tactic assignments are automatically inferred from the technique IDs you enter.
Threat Intelligence
The Threat Intelligence category provides threat feed monitoring, IOC management, and indicator investigation capabilities.
Threat Intelligence Dashboard
The Threat Intelligence Dashboard monitors your threat indicator feeds, tracks IOC volumes, and shows matches against your environment in real time.
When to use:
- Daily, to verify threat feeds are healthy and receiving updates
- When monitoring for new threat intelligence matches in your environment
- To assess your threat intelligence coverage across IP, domain, and file hash indicators
Workflow:
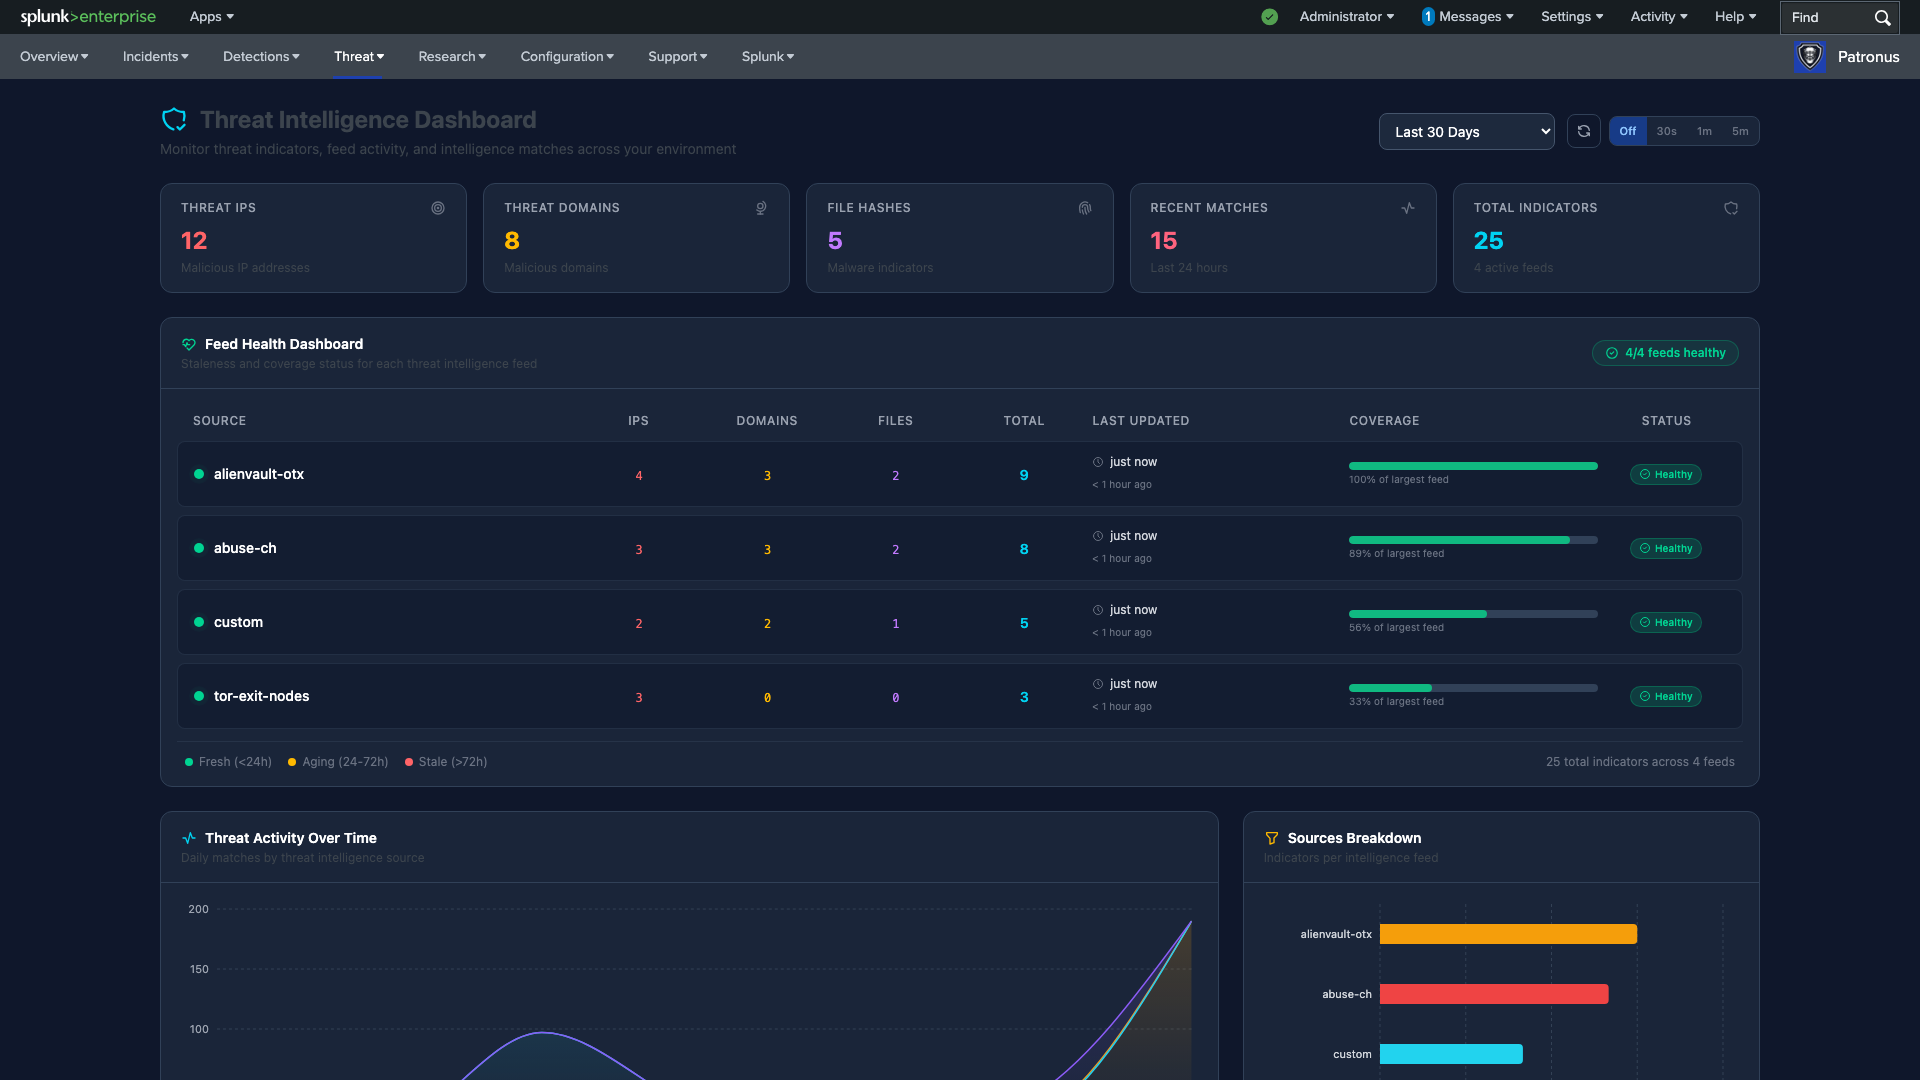
- Review the Indicator KPIs — check the counts for Threat IPs, Threat Domains, File Hashes, Recent Matches, and Total Indicators. The "Recent Matches" count is particularly important — it shows how many of your threat intelligence indicators have been seen in your environment during the selected time window.
- Check the Feed Health table — this per-feed status table shows each intelligence source with its indicator counts (IPs, domains, files), last updated time, coverage percentage bar, and health status. Look for feeds marked "Stale" — these haven't received updates and may indicate a broken integration or expired subscription.
- Enable auto-refresh for monitoring — use the configurable refresh interval (30s, 1m, 5m) to keep the dashboard current during active monitoring sessions.
- Review the Threat Activity Over Time chart — this shows daily matches by threat intelligence source. Spikes indicate either a new campaign hitting your environment or a newly added feed matching historical data.
- Analyze the Sources Breakdown — the horizontal bar chart shows indicators per intelligence feed. Use this to understand which feeds provide the most coverage and justify feed subscriptions.
- Investigate specific matches — when you see matches that need investigation, click through to the Threat Inspector to perform a deep-dive on specific IOCs.
Important: A "Stale" feed status requires immediate attention. Navigate to Configuration > Threat Feeds to verify the feed URL, API key, and schedule. Stale feeds create blind spots in your threat coverage.
Threat Inspector
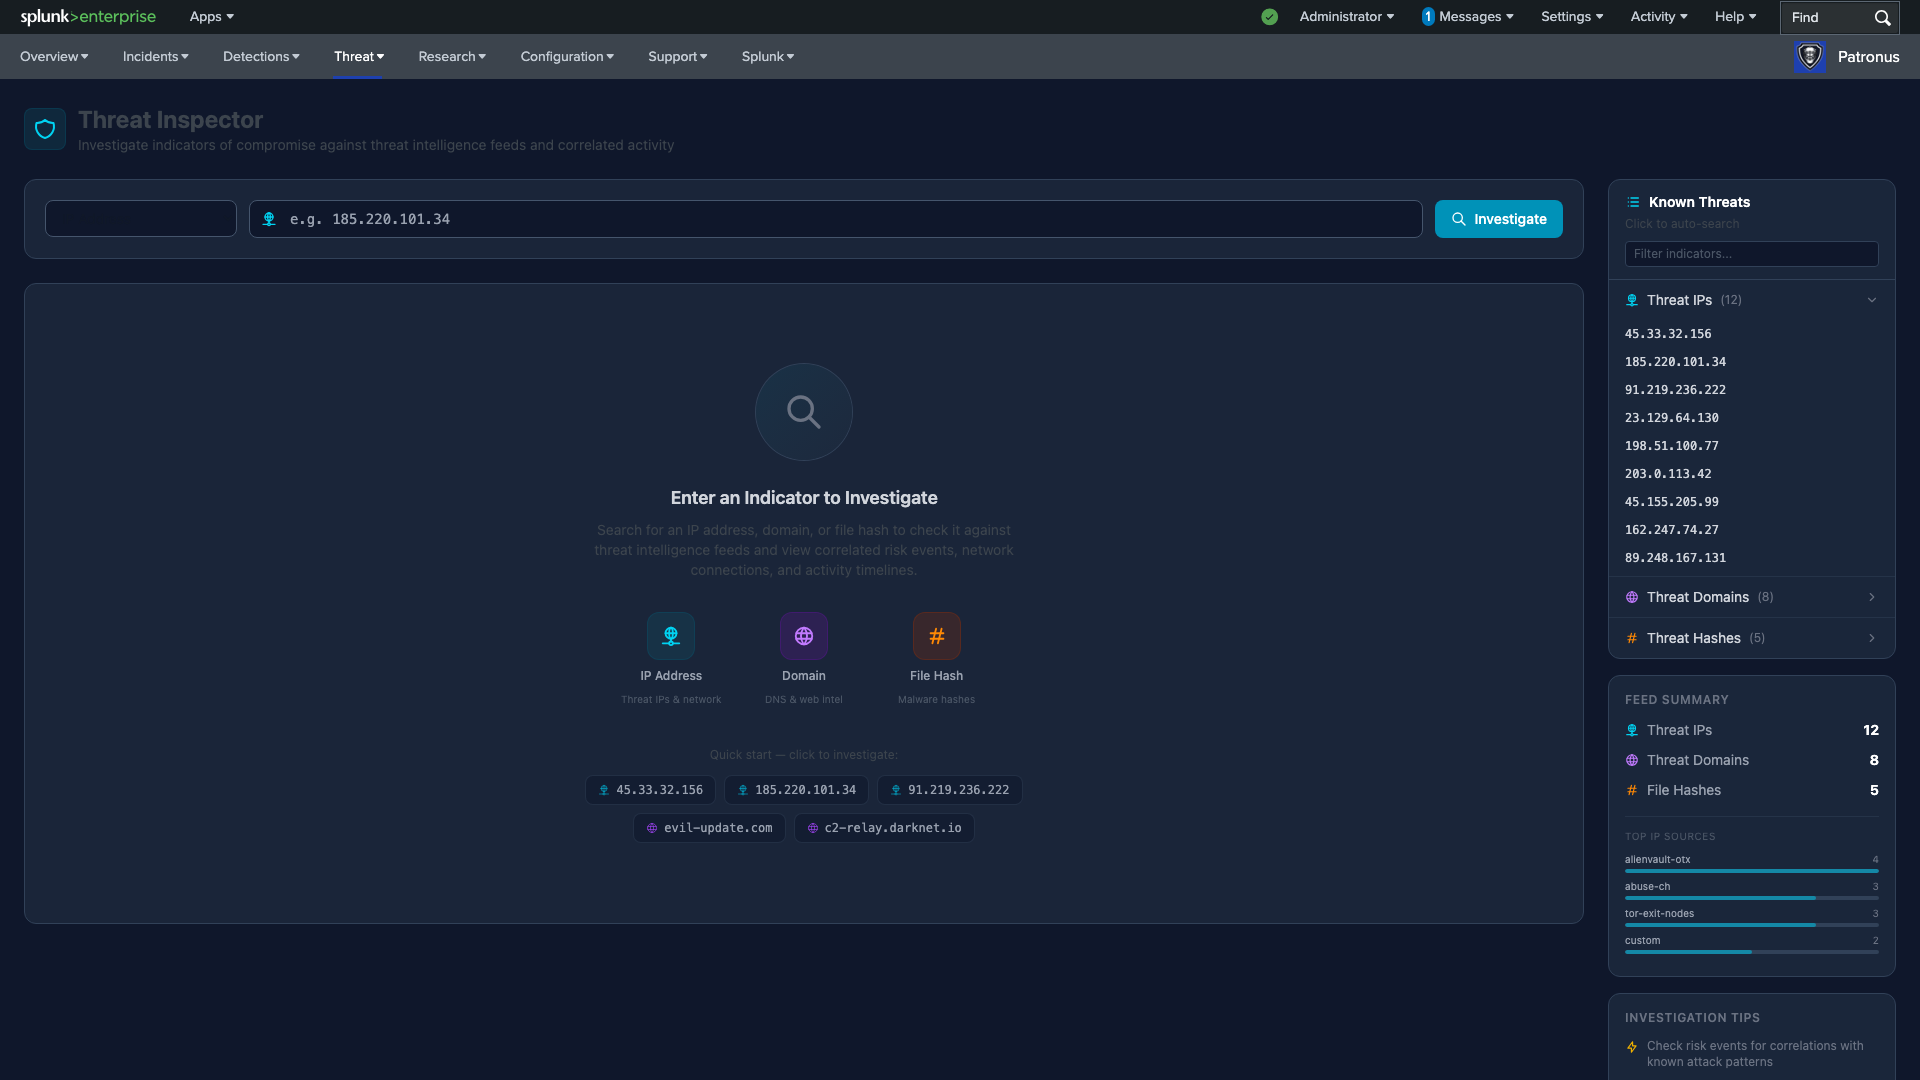
The Threat Inspector is a focused investigation tool for looking up individual indicators of compromise (IOCs) against your threat intelligence feeds and environment data.
When to use:
- When you have a suspicious IP address, domain, or file hash to investigate
- After receiving a threat advisory with specific indicators to check
- When correlating external threat intel with internal activity
- During incident investigation to check if entities are known threats
Workflow:
- Enter an indicator in the search field — type an IP address, domain name, or file hash (MD5/SHA1/SHA256) that you want to investigate.
- Alternatively, browse the Known Threats sidebar — the sidebar lists all known threat IPs, domains, and hashes from your intelligence feeds. Click any indicator to instantly investigate it.
- Review the Feed Summary — check total indicator counts by type (IP, domain, hash) to understand your coverage.
- Submit the search — click the Search/Lookup button or press Enter to run the investigation.
- Examine the investigation results — results include correlated risk events, network connections, and activity timelines for the investigated indicator.
- Check for correlated risk events — these show any detections or risk rules that have fired for this indicator in your environment.
- Review network connections — see all network traffic involving this indicator, including source/destination, ports, and protocols.
- Pivot to entity investigation — if the indicator is associated with internal assets or users, navigate to Asset Deep Dive or Identity Deep Dive for full behavioral context.
Key interactions:
- Click indicators in the Known Threats sidebar for one-click investigation
- Use the Quick Start section for pre-loaded indicators
- Results include drilldown links to raw Splunk events
Research
The Research category provides entity investigation, inventory management, and traffic analysis tools for deep-dive investigations.
Assets (Inventory)
The Assets page manages your asset inventory lookup table (KVStore), which enriches incident data with asset metadata like owner, category, and priority.
When to use:
- When onboarding new assets into the SIEM
- To update asset metadata (owner changes, priority adjustments, category updates)
- For periodic asset inventory audits and cleanup
Workflow:
- Browse the asset inventory — the table shows all registered assets with IP, DNS name, MAC address, category, owner, and priority fields.
- Search or filter — use the search bar to find specific assets by name, IP, or other attributes.
- Add a new asset — click the "Add" button and fill in the asset details. At minimum, provide an IP or hostname for correlation to work.
- Edit an existing asset — click the edit button on any row to update its metadata. Common updates include changing the owner when personnel rotate or updating priority when an asset's criticality changes.
- Delete obsolete assets — remove decommissioned assets to keep the inventory clean and prevent false enrichment.
Tip: Keep your asset inventory up to date. Accurate asset metadata improves incident context — when an incident fires on a critical server owned by a known team, the response is faster and more accurate.
Asset Deep Dive
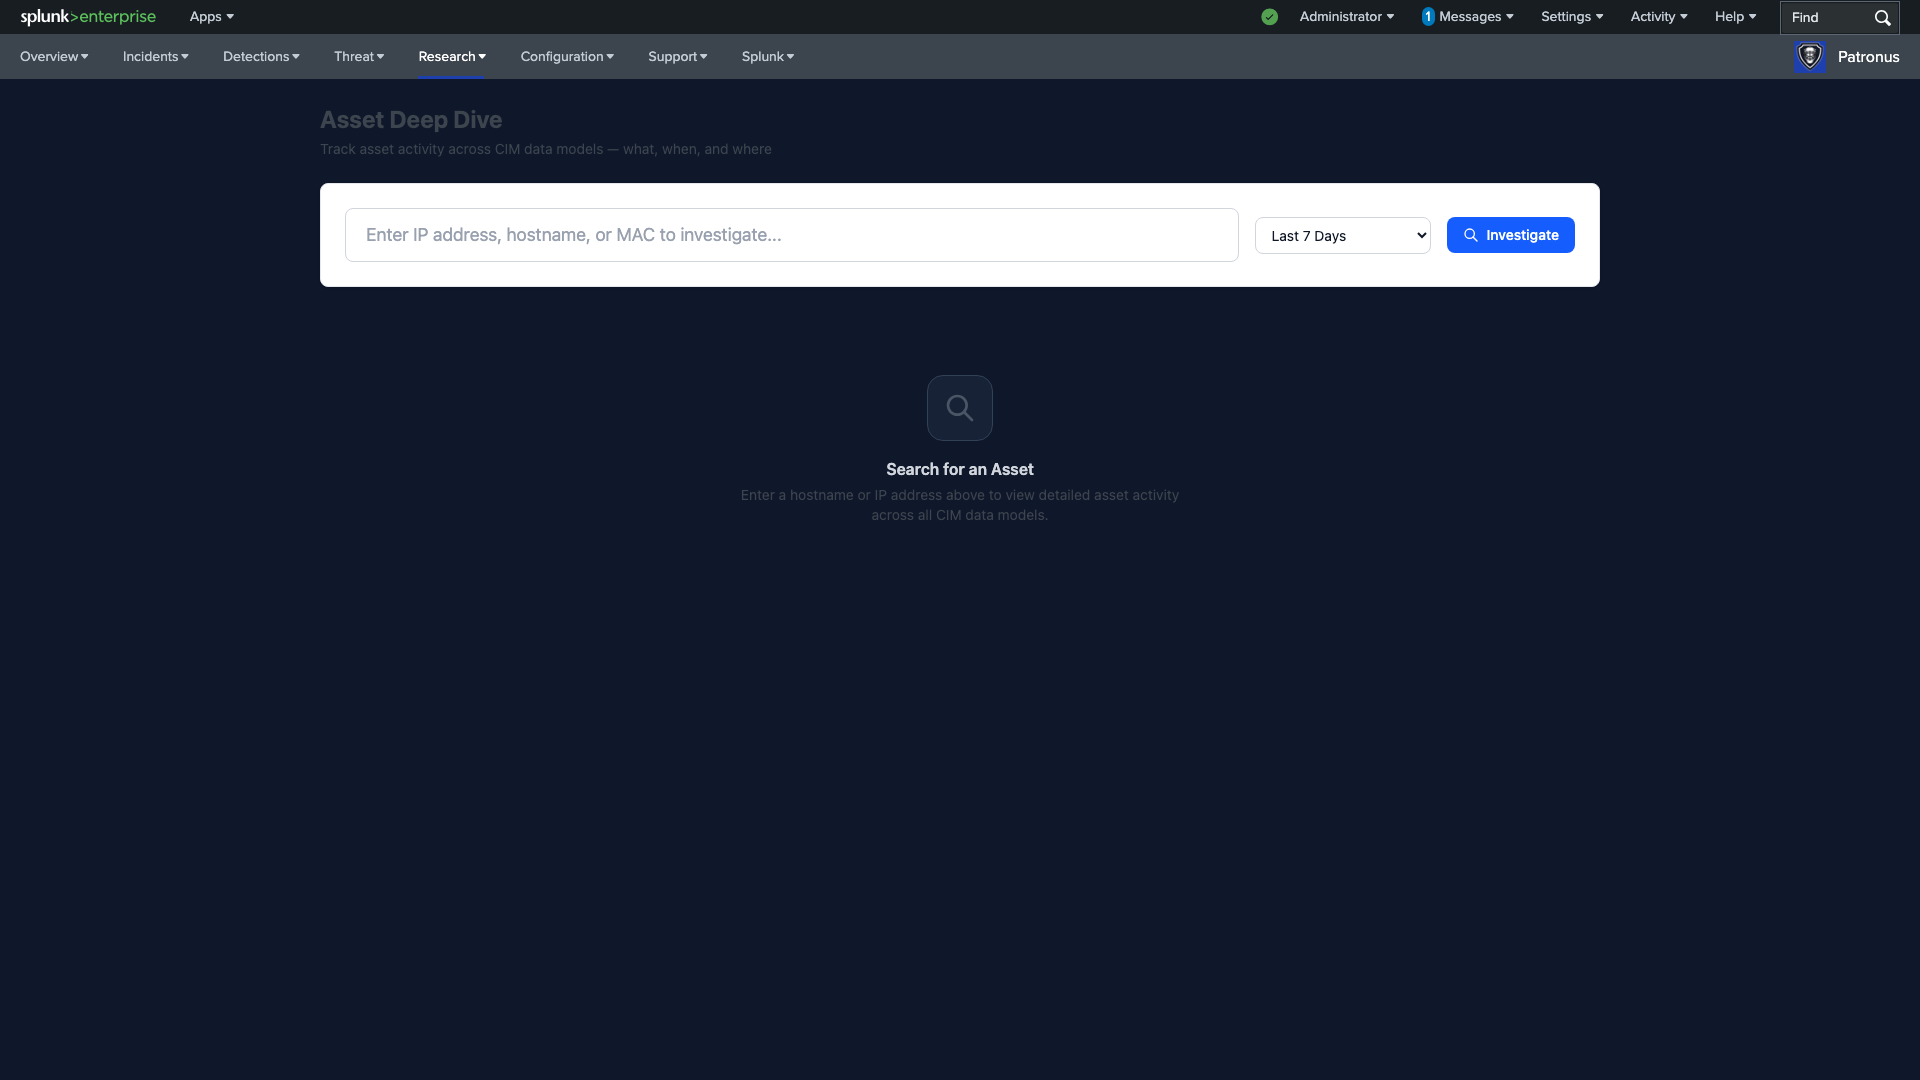
The Asset Deep Dive provides comprehensive behavioral analysis for any host or device, correlating activity across all CIM data models.
When to use:
- When investigating a host identified in an incident or risk event
- To build a behavioral baseline for a suspicious asset
- When performing threat hunting focused on a specific endpoint
- To understand all activity associated with a compromised host
Workflow:
- Enter the asset identifier — type a hostname, IP address, or MAC address in the search field and press Enter.
- Review the Asset Information panel — check the enriched metadata from the asset lookup: IP, DNS name, MAC, category, owner, and priority. Missing metadata means the asset isn't in your inventory — consider adding it.
- Check the Activity KPIs — review Total Events, Active Models (out of 5), Risk Score, Risk Events, Connections, First Seen, and Last Seen. A high risk score or recent "First Seen" on a known device is suspicious.
- Analyze CIM Data Model Swimlanes — this visualization shows activity across five data models: Authentication, Endpoint, Network Traffic, Web, and IDS. Each lane shows event volume over time. Look for unusual patterns:
- Authentication spikes may indicate brute force or credential stuffing
- Endpoint activity bursts may indicate malware execution or system changes
- Network traffic anomalies may indicate data exfiltration or C2 communication
- IDS events confirm known attack signatures
- Click any swimlane for a breakdown — this expands the lane to show detailed event categories, sources, and actions within that data model.
- Review the Combined Activity Timeline — the multi-series area chart overlays all data model activity on one timeline, making it easy to correlate events across different data sources.
- Examine Connection Analysis — review network connections to and from the asset, including remote IPs, ports, and protocols. Look for unexpected outbound connections to suspicious IPs or unusual ports.
- Correlate and document findings — navigate back to Incident Management to add your investigation notes, or pivot to Identity Deep Dive if user accounts are involved.
Identities (Inventory)
The Identities page manages your identity inventory lookup table (KVStore), which enriches incident data with user metadata like department, manager, and priority.
When to use:
- When onboarding new users or service accounts into the SIEM
- To update identity metadata (role changes, manager updates, departures)
- For periodic identity inventory audits
Workflow:
- Browse the identity roster — the table shows all registered identities with username, display name, email, manager, category, and priority.
- Search or filter — use the search bar to find specific users by name, username, or email.
- Add a new identity — click "Add" and fill in the user details. Include the username exactly as it appears in authentication logs for correlation to work correctly.
- Edit identity records — update metadata when users change roles, departments, or managers.
- Remove departed users — delete identities for users who have left the organization to keep the inventory current.
Identity Deep Dive
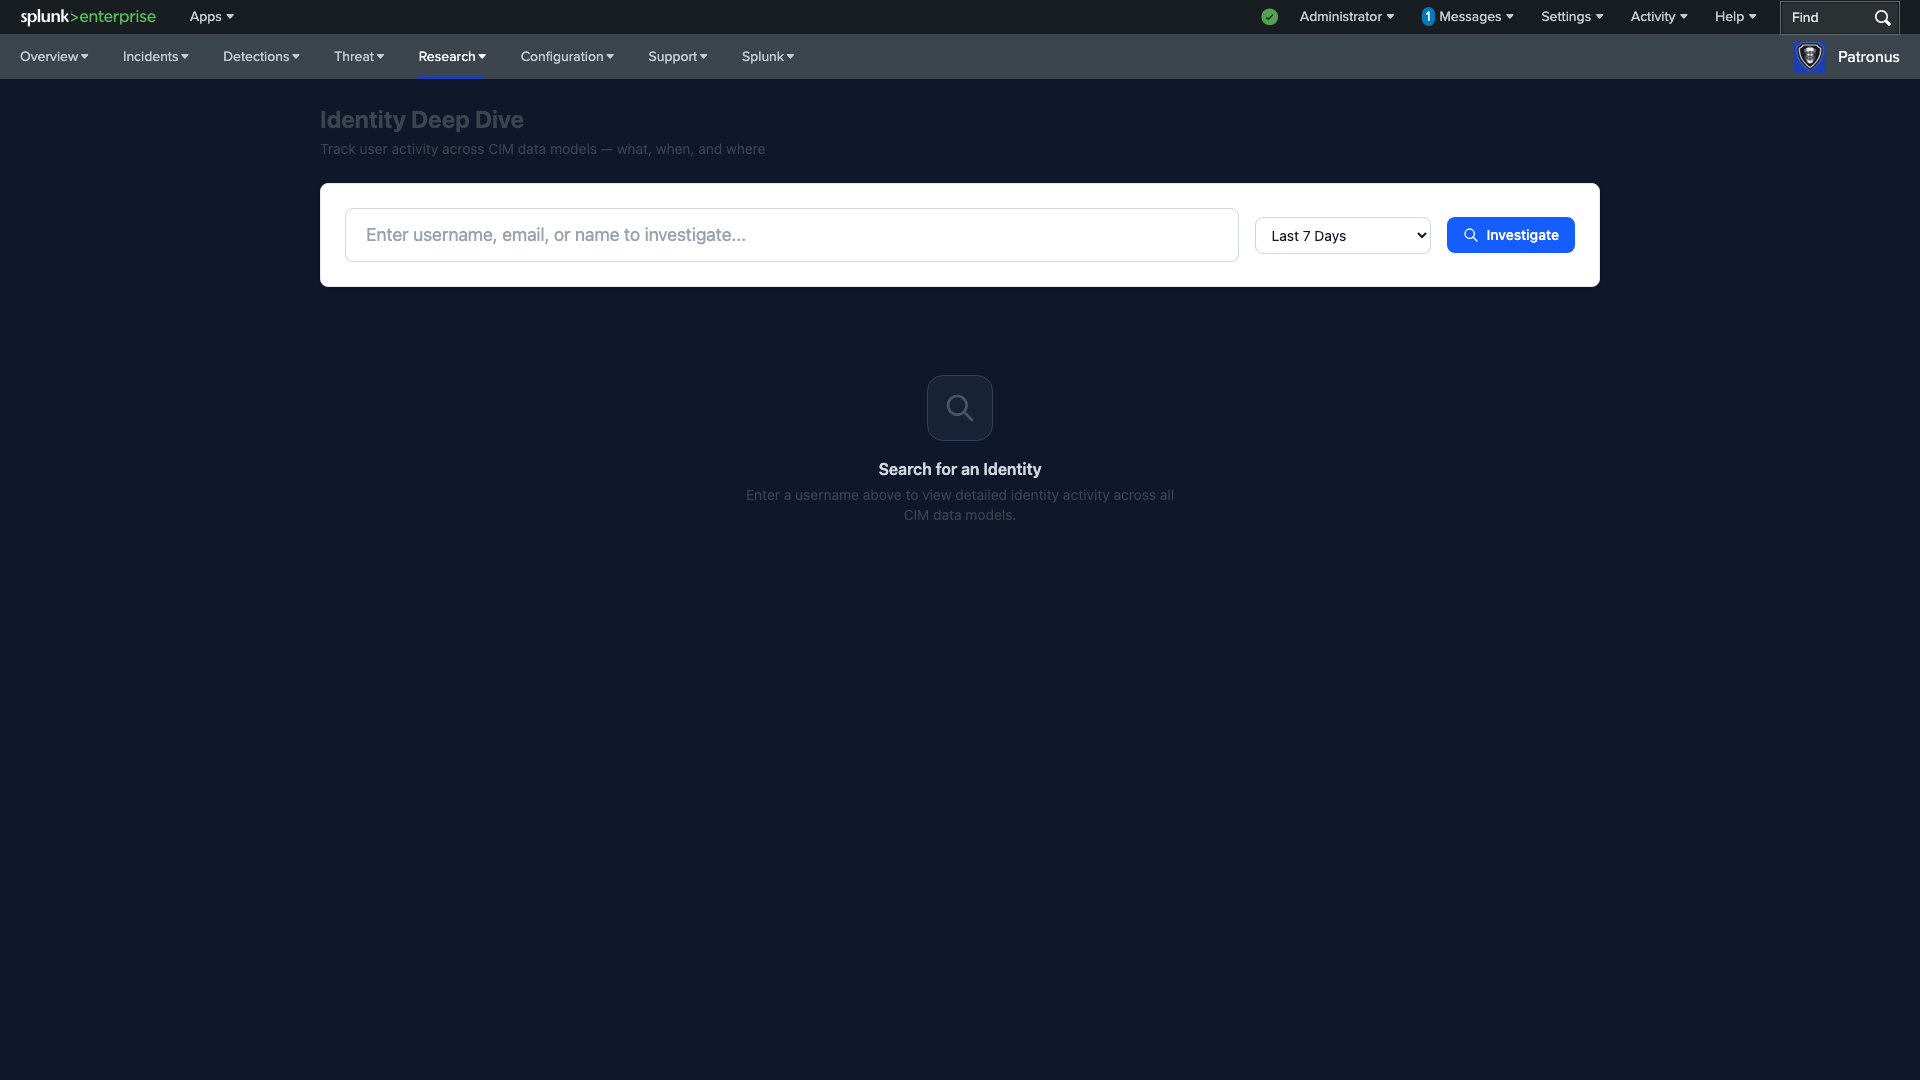
The Identity Deep Dive provides comprehensive behavioral analysis for any user account, correlating activity across authentication, access, and risk data models.
When to use:
- When investigating a user identified in an incident or risk event
- To assess whether a user account may be compromised
- When reviewing access patterns for insider threat investigation
- To correlate user activity with asset activity during an incident
Workflow:
- Enter the user identifier — type a username, email address, or display name in the search field and press Enter.
- Review the Identity Information panel — check enriched metadata: username, display name, email, manager, category, and priority. Verify this matches the user you're investigating.
- Check the Activity KPIs — review Total Events, Active Models, Risk Score, Risk Events, Auth Events, Failed Logins, First Seen, and Last Seen. High failed login counts are an immediate red flag.
- Analyze CIM Data Model Swimlanes — the identity-focused swimlane visualization shows activity across relevant data models. Look for:
- Authentication anomalies — logins from unusual locations or at unusual times
- Privilege escalation patterns — sudden access to new resources
- Data access spikes — unusual download or access volumes
- Review Authentication Activity — the login/logoff timeline with success/failure breakdown shows the user's authentication patterns. Look for failed login clusters (brute force), logins from multiple geographic locations (credential sharing or compromise), or logins outside normal hours.
- Check Risk Events — review all risk-generating events attributed to this identity. Cross-reference with the user's normal behavior to distinguish true threats from false positives.
- Correlate with asset activity — if the user logged into specific systems, navigate to Asset Deep Dive for those hosts to see what happened after authentication.
Tip: When investigating a compromised account, always check both the Identity Deep Dive (for authentication patterns) and Asset Deep Dive (for each system the user accessed). This gives you the complete picture of what the attacker did after gaining access.
Network Analysis
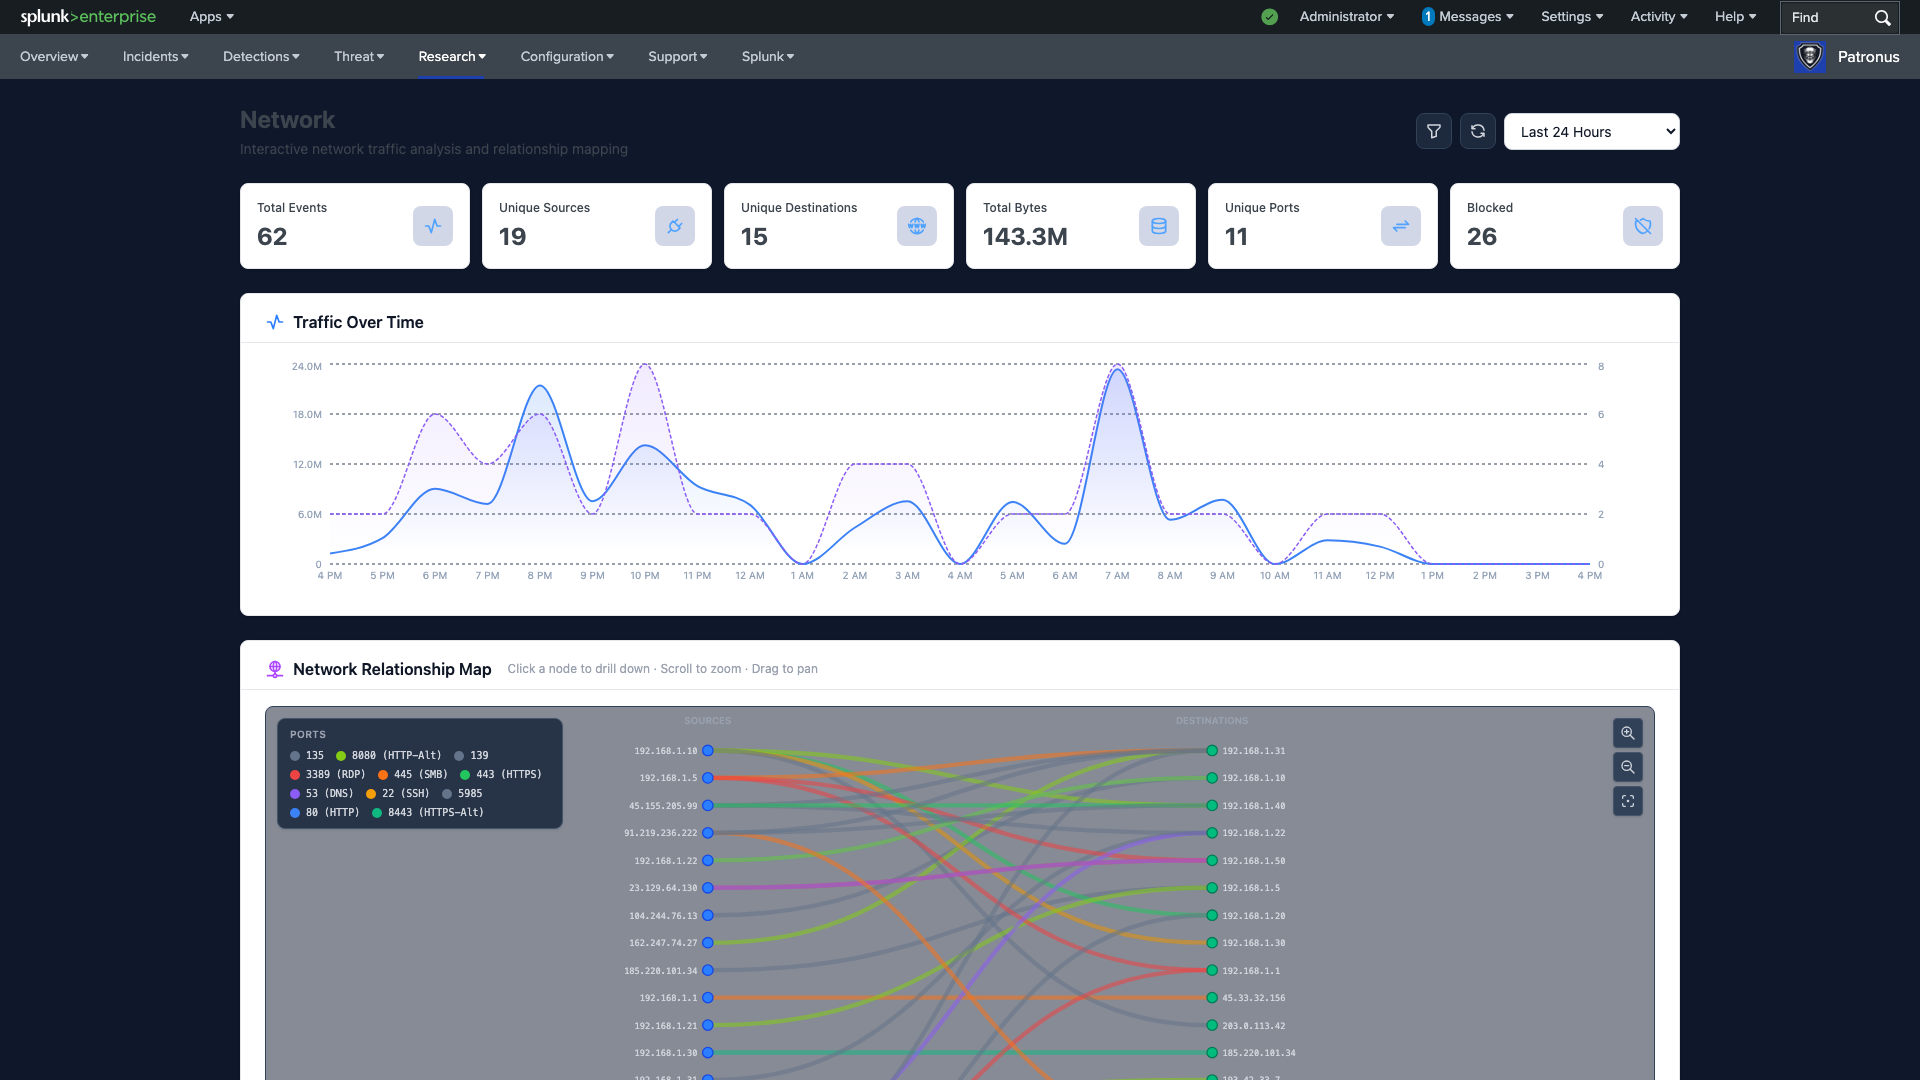
The Network page provides interactive traffic analysis, relationship mapping, and communication pattern visualization for network-level investigation.
When to use:
- When investigating network-based attacks (lateral movement, C2, exfiltration)
- For traffic pattern analysis and anomaly detection
- When you need to understand communication relationships between hosts
- To identify top talkers consuming bandwidth or making suspicious connections
Workflow:
- Review the Traffic KPIs — check Total Events, Unique Sources, Unique Destinations, Total Bytes, Unique Ports, and Blocked connections. An unusually high blocked count may indicate an active attack being stopped by your firewall.
- Analyze the Traffic Over Time chart — the dual-axis chart shows byte volume and event count trends. Look for volume spikes outside normal business hours or sustained high-volume transfers that could indicate data exfiltration.
- Explore the Network Relationship Map — this interactive Sankey-style visualization shows connections between source and destination IPs, color-coded by port/protocol:
- Click nodes (IP addresses) to drill down and see their specific connections
- Scroll to zoom in/out on the relationship map
- Drag to pan across the visualization
- Look for unexpected connections between internal and external IPs
- Review the Top Talkers tables — ranked tables show top source and destination IPs by volume. Unfamiliar external IPs at the top of the destination list warrant investigation.
- Analyze Port Distribution — check traffic distribution across ports and protocols. Unusual ports (non-standard HTTP, high-numbered ports) may indicate tunneling or C2 channels.
- Filter by time range — narrow the time window to focus on specific incidents or time periods of interest.
- Pivot to entity investigation — for any suspicious IP, navigate to Asset Deep Dive to see full behavioral context or to Threat Inspector to check if it's a known threat.
Vulnerability Management
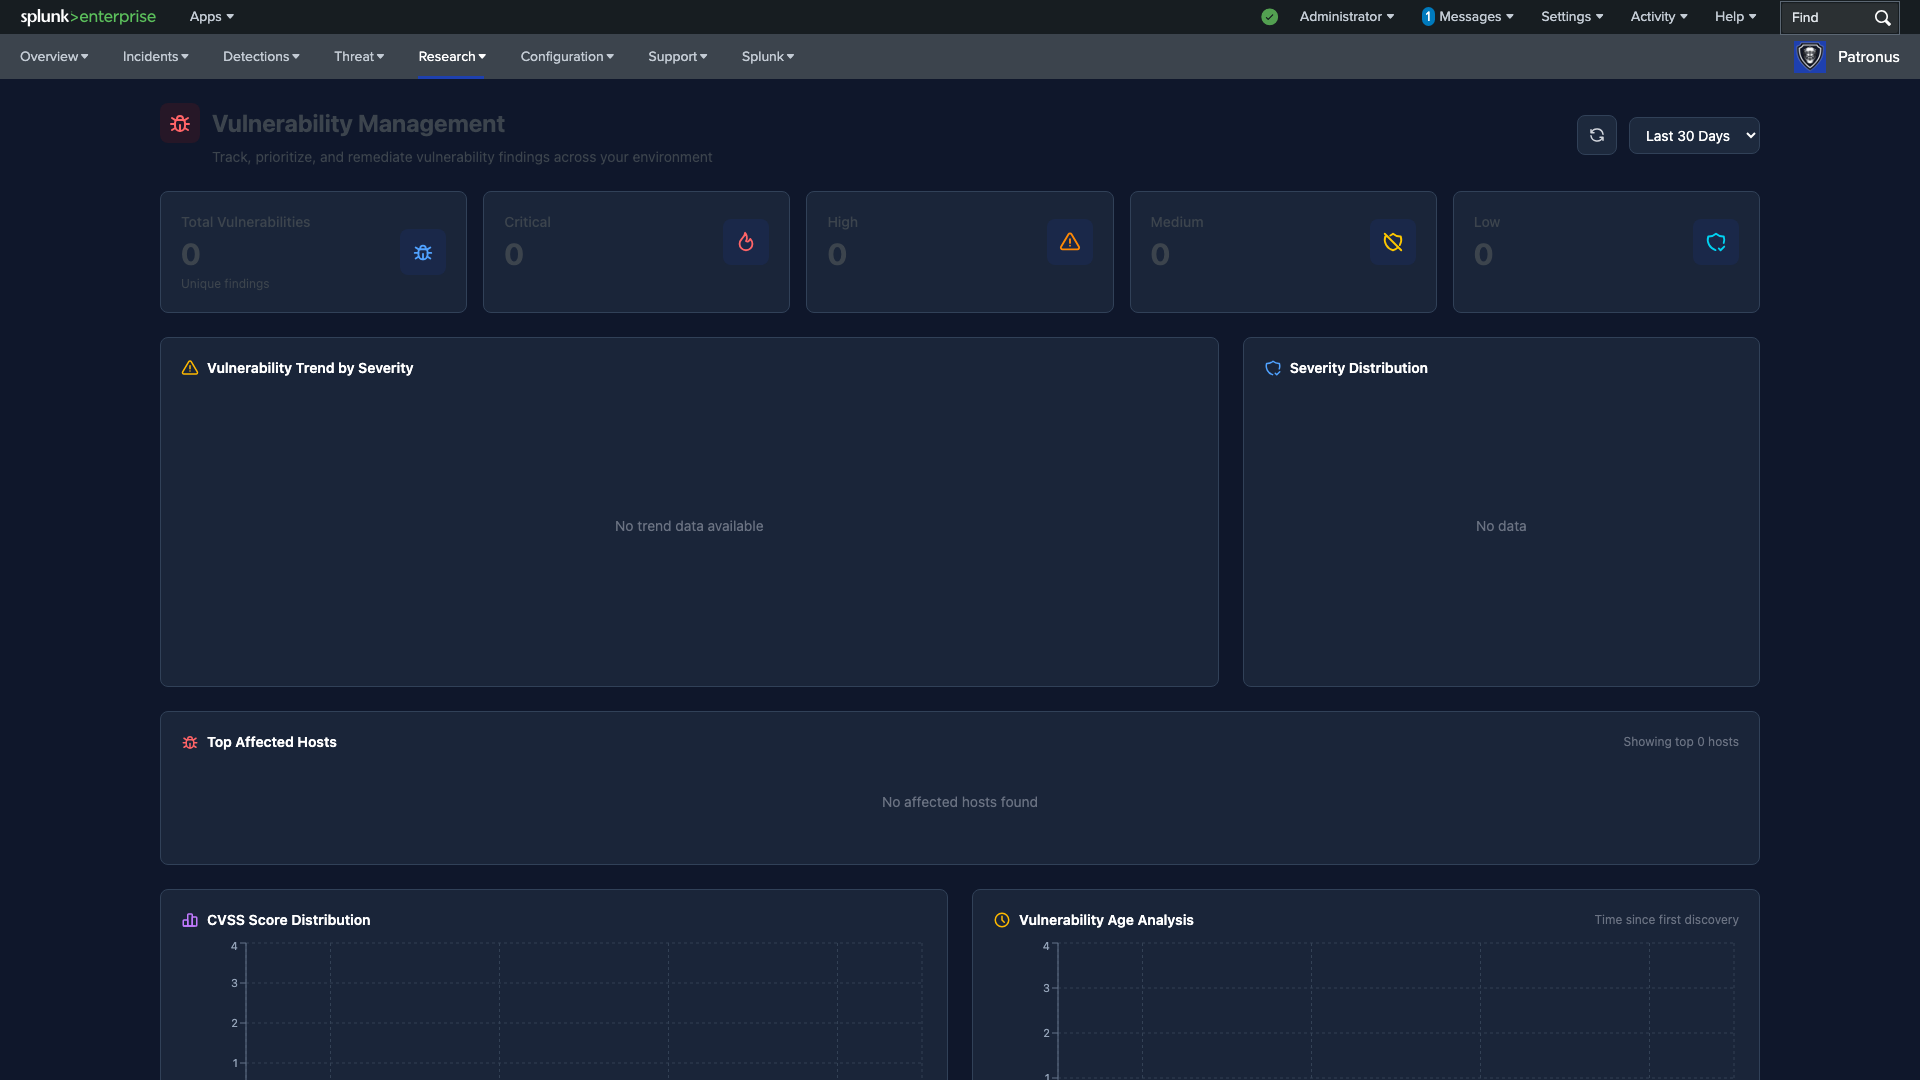
The Vulnerabilities page tracks, prioritizes, and helps manage vulnerability findings across your environment with severity analysis and remediation prioritization tools.
When to use:
- During weekly vulnerability review meetings
- When prioritizing which vulnerabilities to patch first
- For compliance reporting on vulnerability posture
- After a new scan to assess the impact of newly discovered vulnerabilities
Workflow:
- Review the Severity Summary cards — check Total Vulnerabilities, Critical, High, Medium, and Low counts. Focus on the Critical and High counts first — these represent the highest risk to your environment.
- Analyze the Vulnerability Trend chart — the stacked area chart shows severity distribution over time. An upward trend in Critical/High means new vulnerabilities are being discovered faster than they're being remediated.
- Check the Severity Distribution pie chart — understand the overall proportion of vulnerabilities at each severity level.
- Review Top Affected Hosts — the ranked list shows which hosts have the most vulnerability findings. These are your highest-risk assets and should be prioritized for patching.
- Examine the CVSS Score Distribution — this bar chart helps you understand the risk profile of your vulnerability findings based on industry-standard scoring.
- Review the Vulnerability Age Analysis — older unpatched vulnerabilities represent increasing risk. Focus remediation efforts on high-severity vulnerabilities that have been open the longest.
- Create a remediation plan — based on your analysis, prioritize patching by combining severity, CVSS score, asset criticality (from the Assets inventory), and vulnerability age.
Configuration & Administration
The Configuration category provides system administration, health monitoring, and operational settings management.
Setup Check
The Setup Check page validates that all Patronus SIEM prerequisites and dependencies are properly configured.
When to use:
- Immediately after initial installation to validate the deployment
- After upgrading Patronus to a new version
- When troubleshooting issues with dashboards or detections not working
Workflow:
- Navigate to Setup Check — the page automatically runs validation checks when it loads.
- Review the checklist — each prerequisite shows a pass/fail status. Green checkmarks indicate healthy components; red X marks indicate issues that need resolution.
- Address any failures — click on failed checks to see remediation guidance. Common issues include missing data model accelerations, unconfigured lookups, or missing app dependencies.
- Re-run after fixes — refresh the page after making changes to verify the issues are resolved.
Configuration Management
The Configuration page provides a unified tabbed interface for managing all Patronus SIEM operational settings.
When to use:
- During initial setup to configure all required settings
- When onboarding new analysts, assets, or identities
- To manage suppression rules when detection rules need tuning
- When adding or updating threat intelligence feed sources
- To adjust SLA targets based on organizational requirements
Workflow — Suppression Filters:
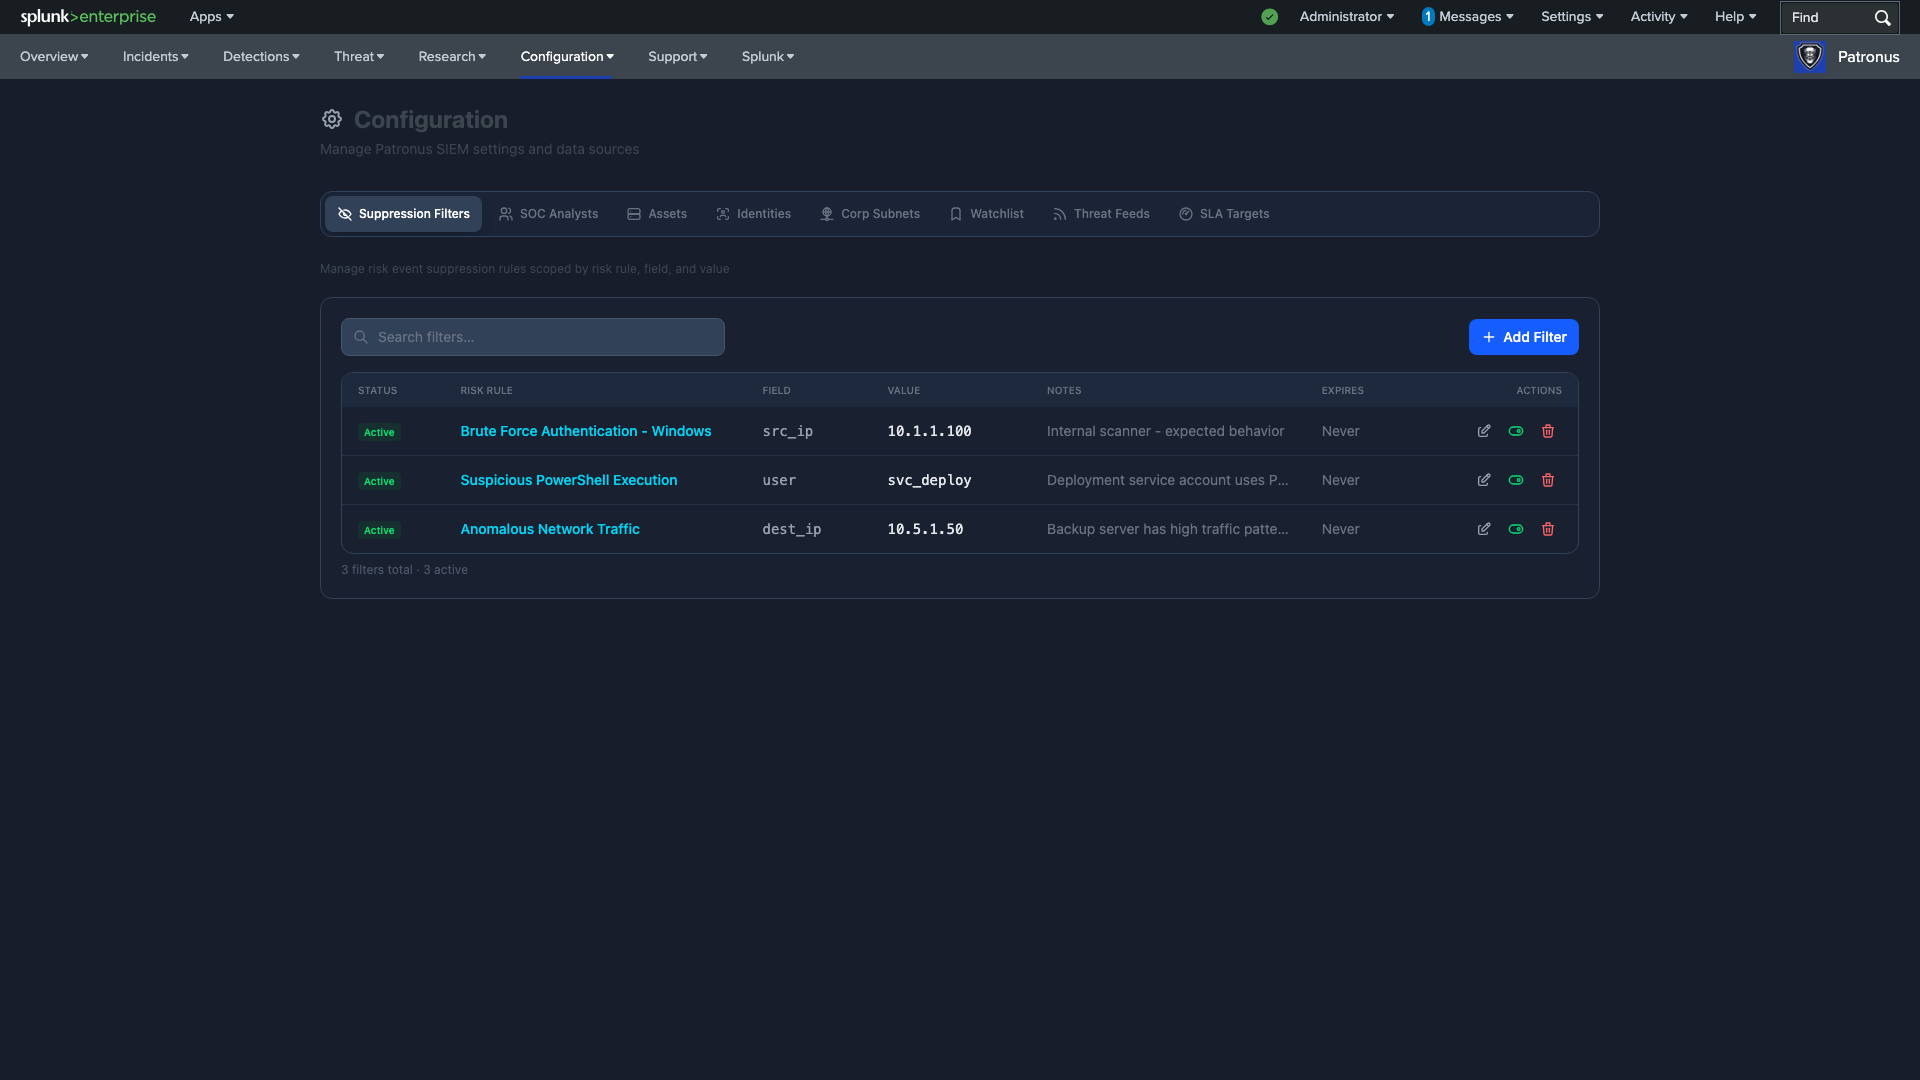
- Select the Suppression tab — this manages risk event suppression rules that prevent known false positives from generating noise.
- Review existing filters — each filter shows its status, risk rule name, field, value, notes, and expiration date.
- Add a new suppression filter — click "Add" and specify the risk rule to suppress, the field and value to match, notes explaining why, and an optional expiration date.
- Review expiring filters — check for filters approaching expiration. Expired suppressions will stop working and may cause previously suppressed alerts to reappear.
Workflow — SOC Analyst Roster:
- Select the Analyst tab — this manages the list of analysts available for incident assignment.
- Add new analysts — when a new team member joins, add them here so they appear in assignment dropdowns across the application.
- Remove departed analysts — when an analyst leaves, remove them and reassign their open incidents.
Workflow — Network Configuration:
- Select the Corp Subnets tab — define your internal network ranges in CIDR notation.
- Add all internal subnets — this is critical for accurate "internal vs. external" classification in network analysis and threat intelligence correlation.
Workflow — Threat Feed Management:
- Select the Threat Feeds tab — configure external threat intelligence sources.
- Add a new feed — provide the feed URL, API key (if required), refresh schedule, and indicator types.
- Monitor feed health — check the Threat Intelligence Dashboard for feed status after configuration changes.
Workflow — SLA Configuration:
- Select the SLA Targets tab — configure Mean Time to Acknowledge (MTTA) and Mean Time to Resolve (MTTR) targets.
- Set targets by severity — different severity levels typically have different SLA requirements (e.g., Critical: 15 min MTTA / 4 hr MTTR).
- Verify on dashboards — after setting targets, check the Executive Summary and Incident Analysis pages to confirm the SLA gauges reflect your new targets.
System Health (Performance)
The System Health page monitors Patronus SIEM operational performance, including search execution, data model acceleration, and detection scheduling.
When to use:
- Weekly, as part of regular system health checks
- When dashboards are loading slowly or showing stale data
- After enabling new detection rules to verify they're running correctly
- When troubleshooting missing data or detection gaps
Workflow — Overview Tab:
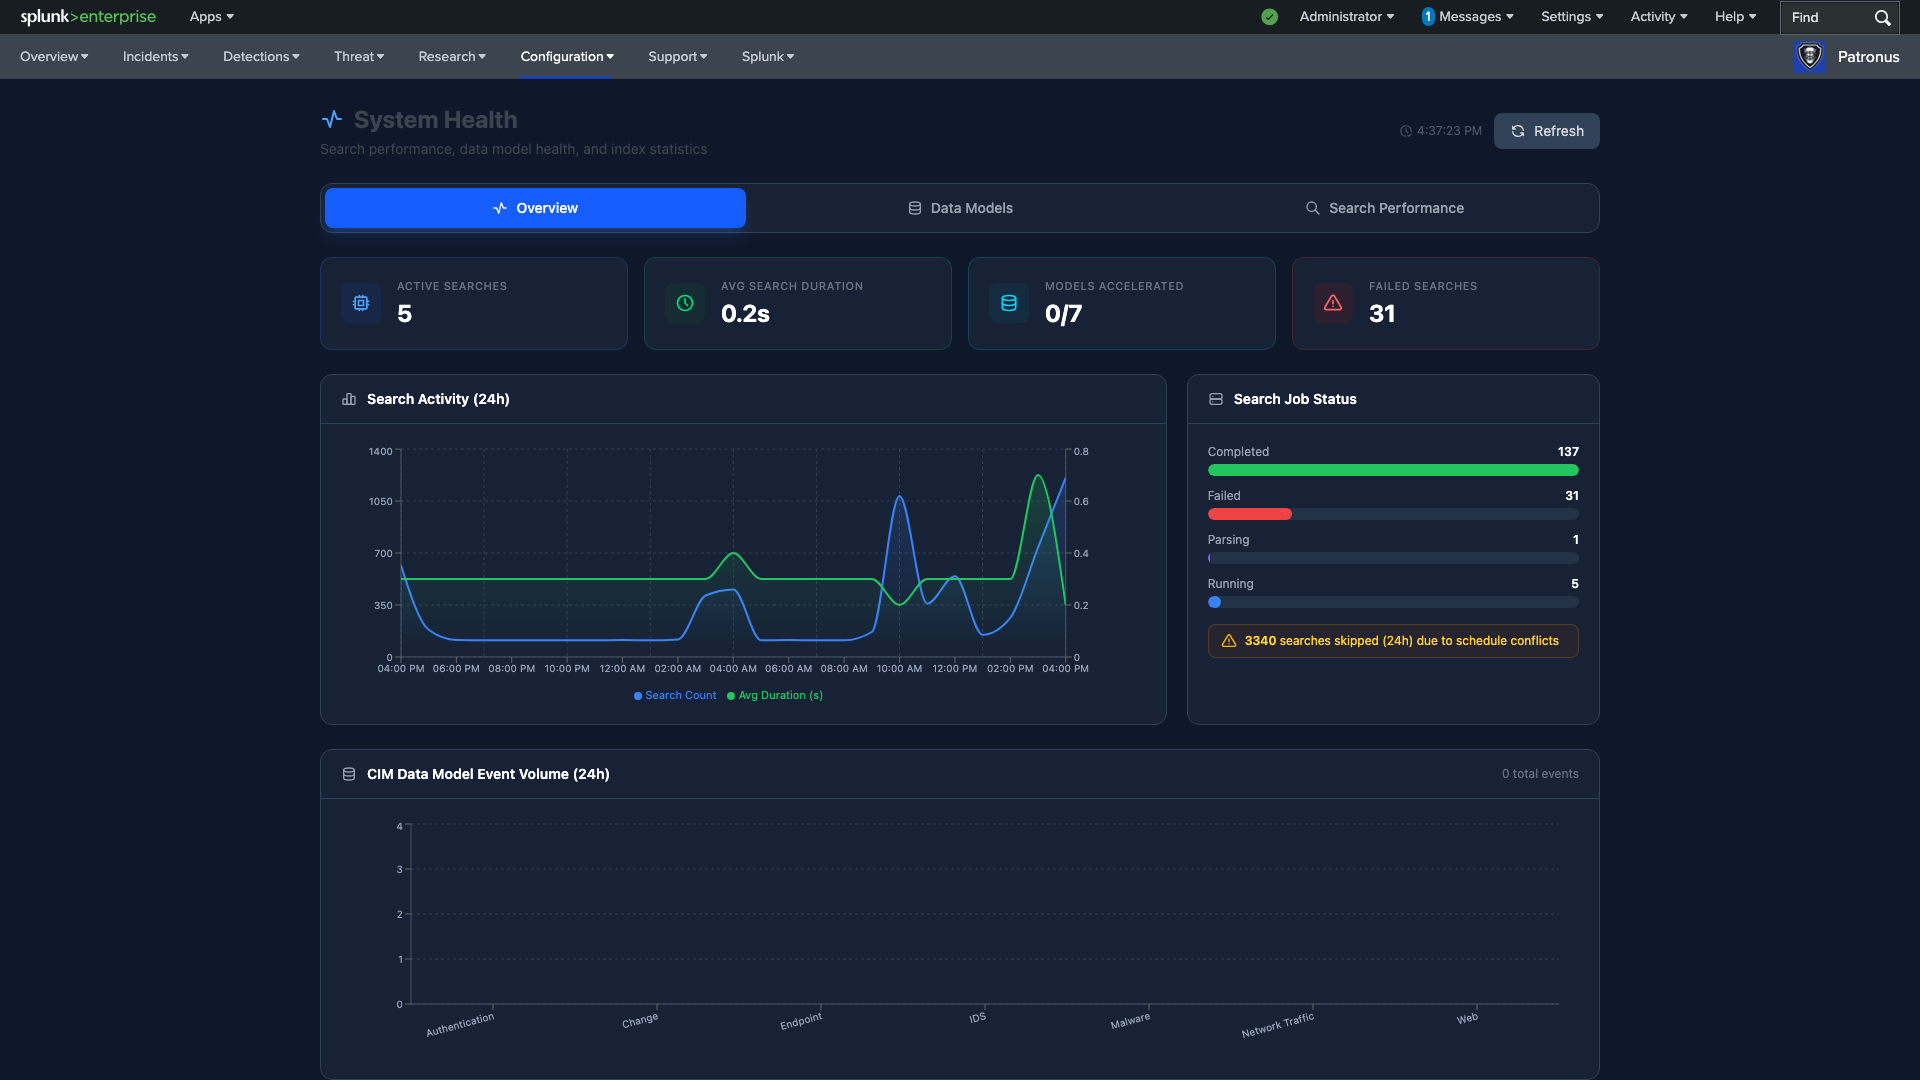
- Check the Overview KPIs — review Active Searches, Avg Search Duration, Models Accelerated, and Failed Searches. Any non-zero failed search count needs investigation.
- Review Search Activity (24h) — the dual-axis chart shows search count and average duration over the last 24 hours. Duration spikes indicate performance issues or resource contention.
- Inspect the Search Job Status — the horizontal bar chart shows completed, failed, and running counts. "Skipped" warnings appear when schedule conflicts prevent a search from running — this may mean your search schedule is too aggressive for available resources.
- Check CIM Data Model Event Volume — the bar chart shows event counts across Authentication, Change, Endpoint, IDS, Malware, Network Traffic, and Web data models. Missing or zero-volume models indicate data onboarding issues.
Workflow — Data Models Tab:
- Switch to the Data Models tab — this shows acceleration status for each CIM data model.
- Verify all required models are accelerated — non-accelerated models will cause slow dashboard load times and search performance issues.
- Check size and time range — each model shows its accelerated data size, event count, and time range coverage. Ensure the time range covers your typical investigation window.
Workflow — Search Performance Tab:
- Switch to the Search Performance tab — this shows individual scheduled search run times and completion status.
- Identify slow searches — sort by duration to find the slowest-running searches. These are candidates for query optimization.
- Check for failing searches — searches with repeated failures may indicate data source issues, permission problems, or query errors.
- Tune as needed — for slow searches, consider optimizing the SPL query, narrowing the time window, or ensuring the relevant data models are accelerated.
Tip: Check the System Health page every Monday morning. Catching failed searches and stale data models early in the week prevents gaps in your detection coverage and ensures dashboards stay responsive.
License Management
The License Management page monitors your Splunk license usage to ensure you stay within allocated capacity and can plan for growth.
When to use:
- Monthly, to review license usage trends
- When planning to onboard new data sources
- If you receive license violation warnings from Splunk
Workflow:
- Review current license usage — check today's ingestion volume against your licensed daily capacity.
- Check usage trends — review historical usage to identify growth patterns and predict when you'll approach your license limit.
- Monitor approaching limits — if daily usage consistently exceeds 80% of capacity, plan for a license upgrade or identify data sources that can be optimized.
- Investigate spikes — sudden usage increases may indicate a misconfigured data source, a new log source that wasn't planned for, or an attack generating abnormal log volumes.
End-to-End Investigation Workflow
The following workflow demonstrates how multiple Patronus pages work together during a typical security incident investigation. This is the recommended cross-page flow that new SOC analysts should learn.
- Start at the Executive Summary — identify areas of concern from KPIs and posture score.
- Move to the Scoreboard — identify the highest-risk entities that need investigation.
- Open Incident Management — find or create an incident for the entity/event you're investigating.
- Deep-dive into the entity — use Asset Deep Dive (for hosts) or Identity Deep Dive (for users) to understand the full behavioral context.
- Check network context — use the Network page to understand communication patterns if network-based IOCs are involved.
- Investigate threat indicators — use the Threat Inspector to check any suspicious IPs, domains, or hashes against your threat intelligence feeds.
- Check MITRE mapping — reference the MITRE ATT&CK page to understand which attack techniques are involved and check for additional detection coverage.
- Document and resolve — return to Incident Management, add investigation notes, update the status, and assign next steps.
- Hand off if needed — if your shift is ending, use the Shift Handoff page to document findings and generate a report for the incoming analyst.
Tip: Bookmark this end-to-end workflow until it becomes second nature. Consistent investigation methodology ensures nothing is missed and creates a reliable audit trail for every incident.